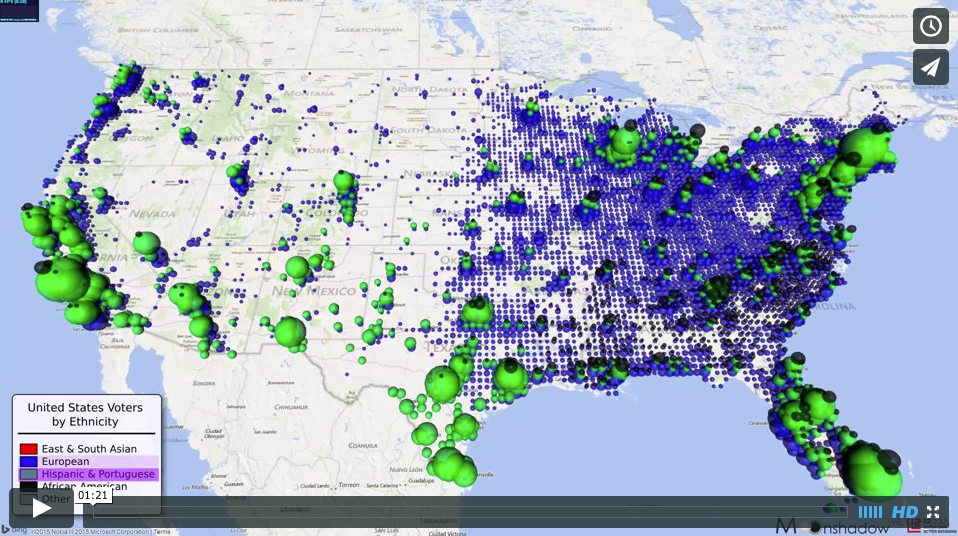
Ethnicity in the US in 3D
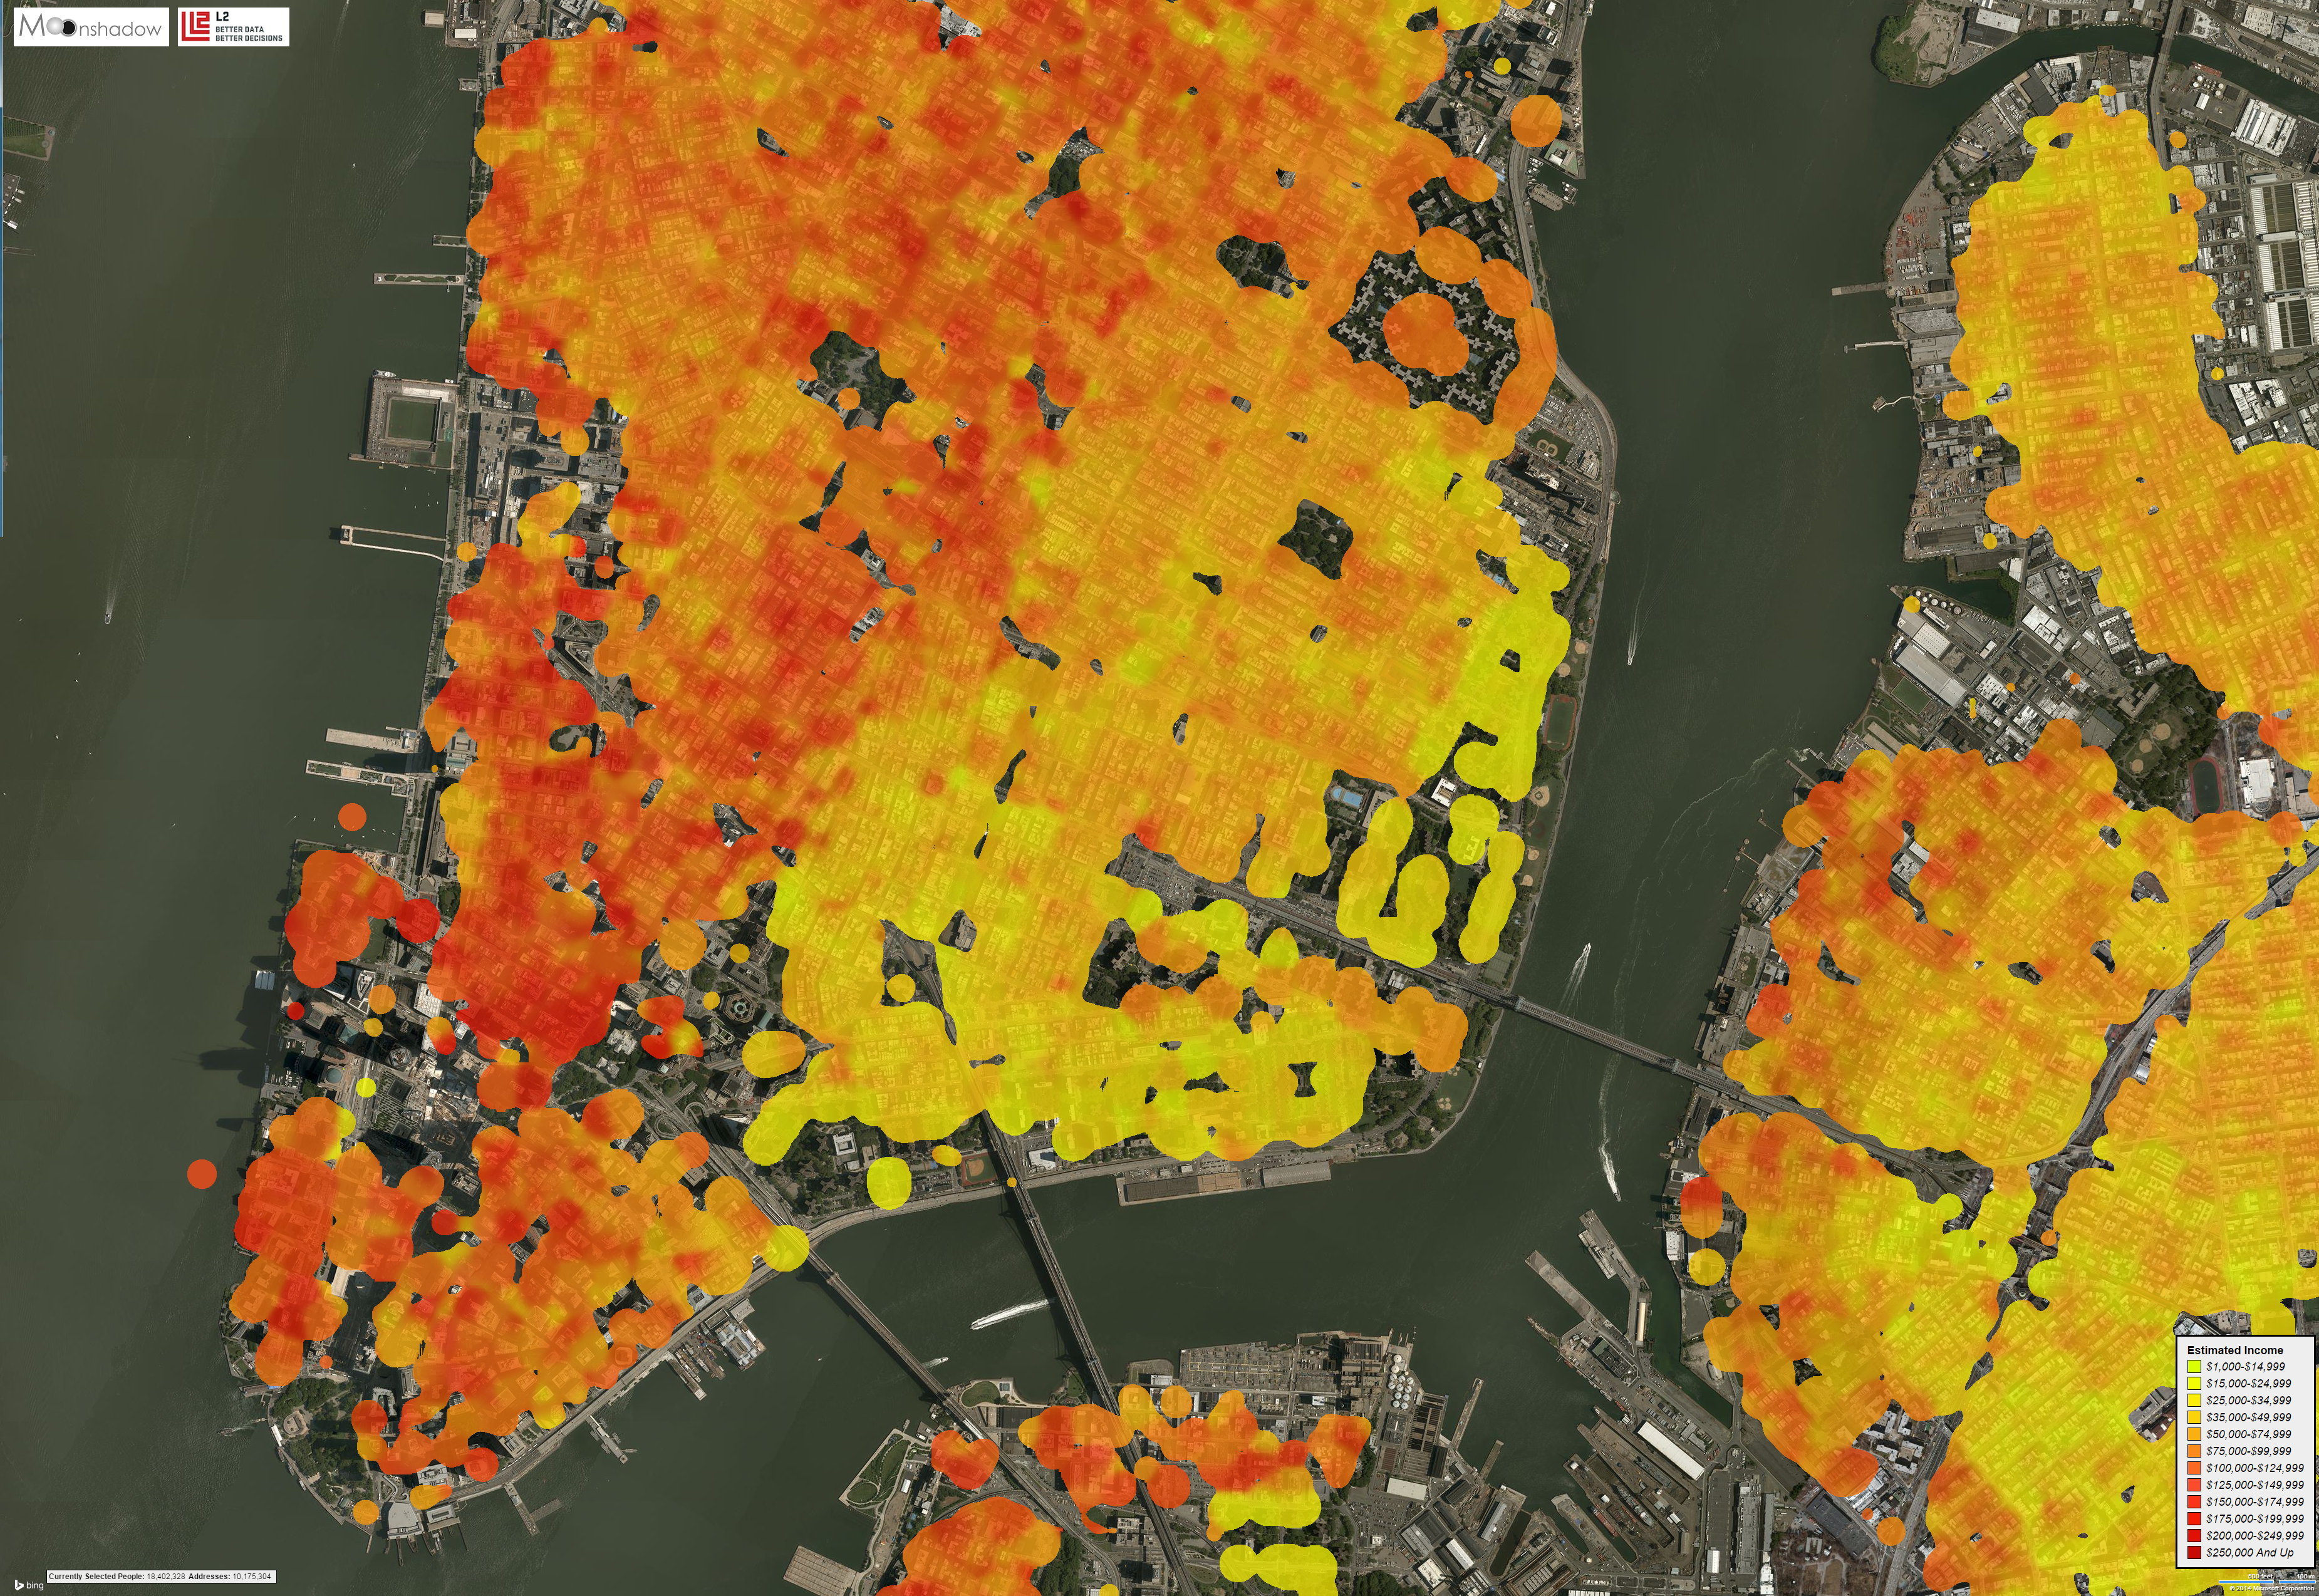
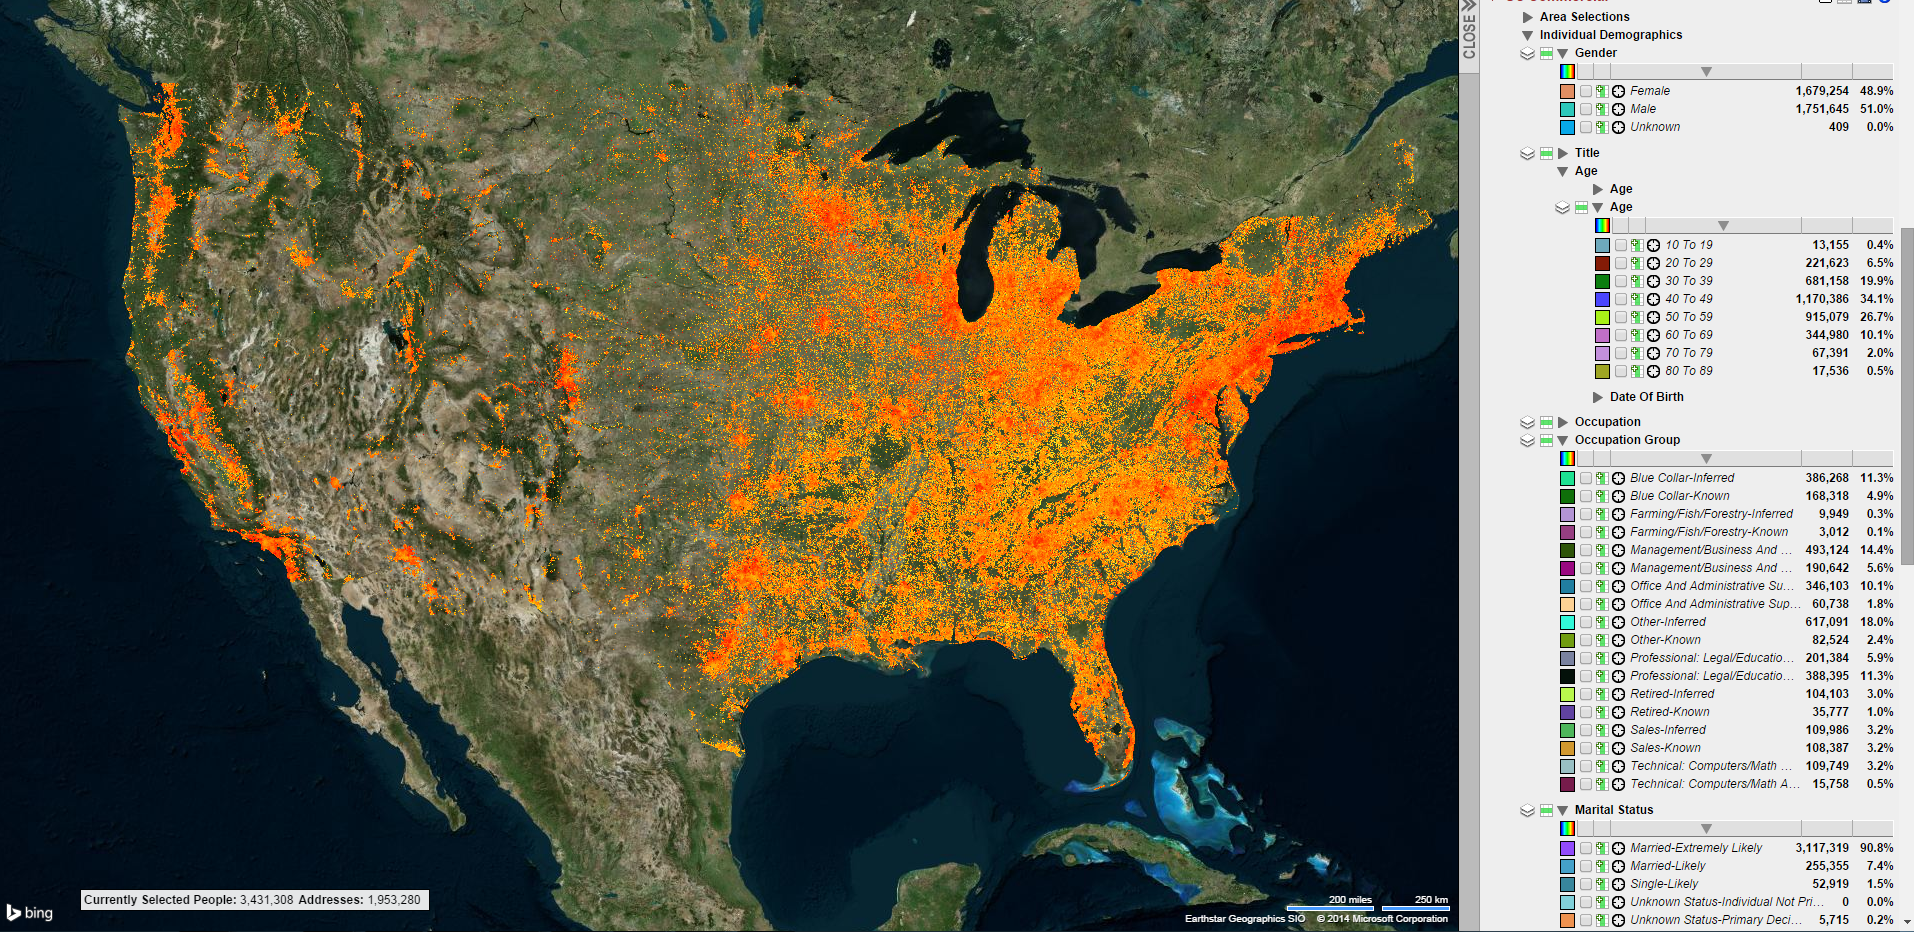
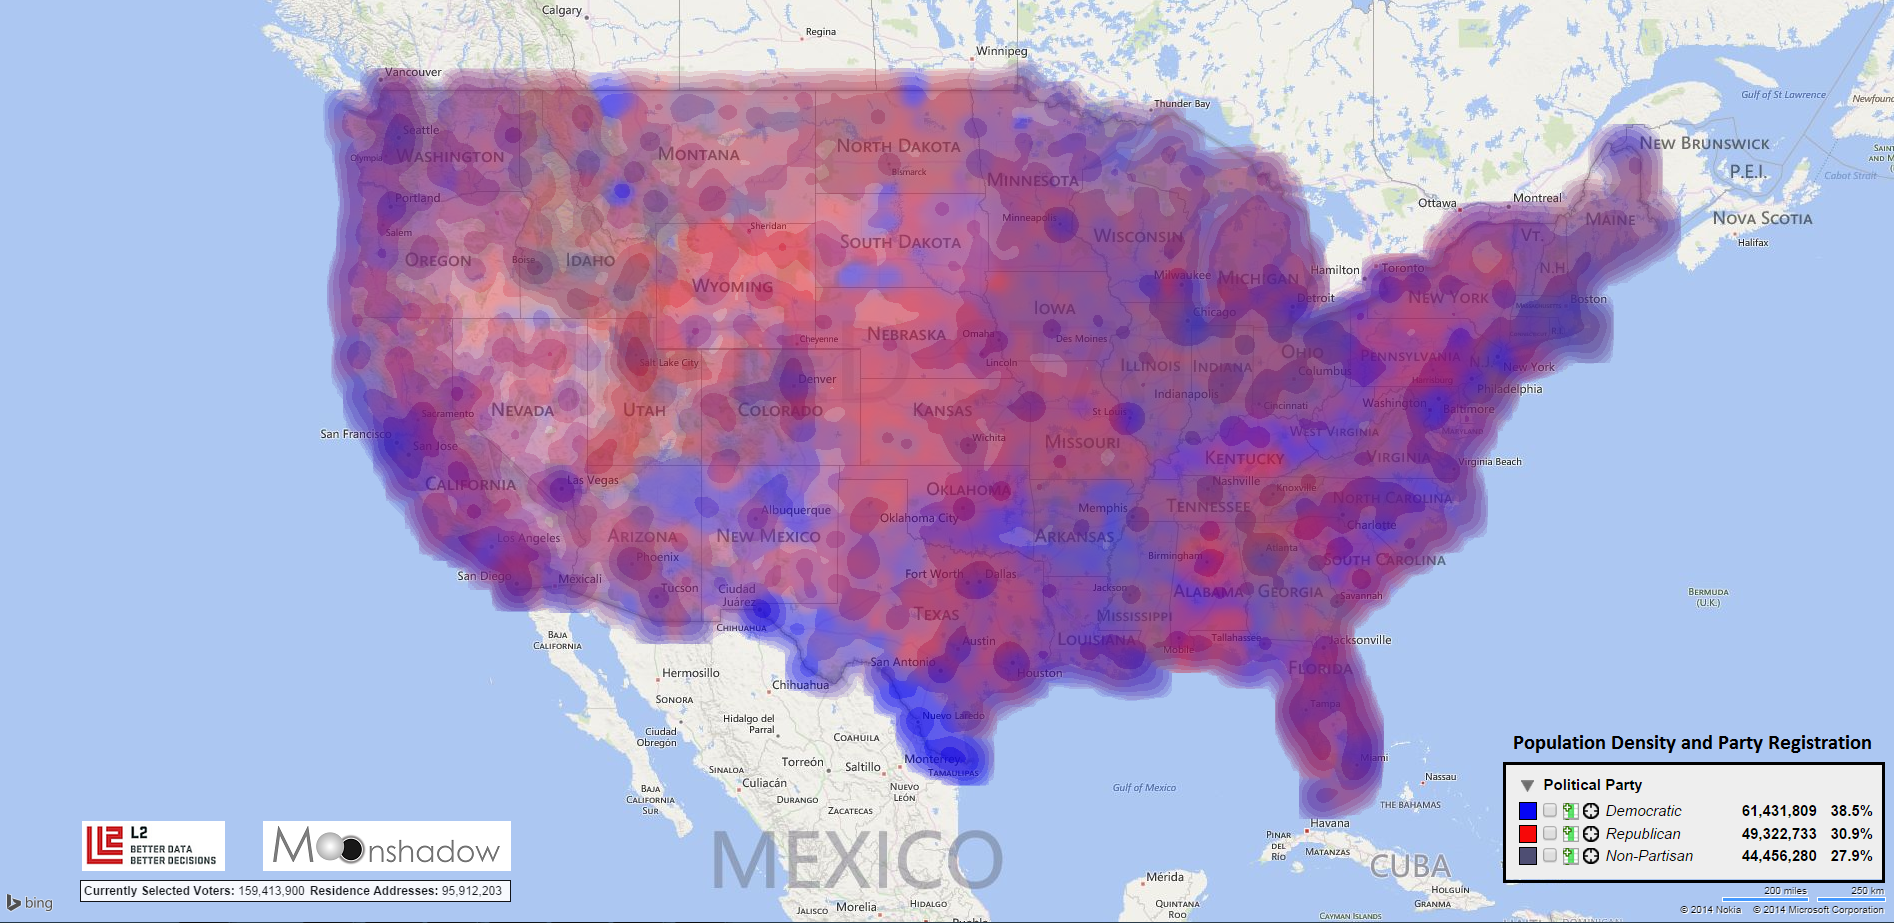
Ethnic groups in the US are distributed unevenly across the nation. The animations below show where they are located and how large they are in relationship to each other. We looked at five different broad ethnic groups: Europeans, East & South Asians, Hispanic and Portuguese and African American. The ‘Other’ group includes all other groups including Native Americans. We used the registered voter data from L2 Political to do this ethnic analysis.
[…]