Project Description
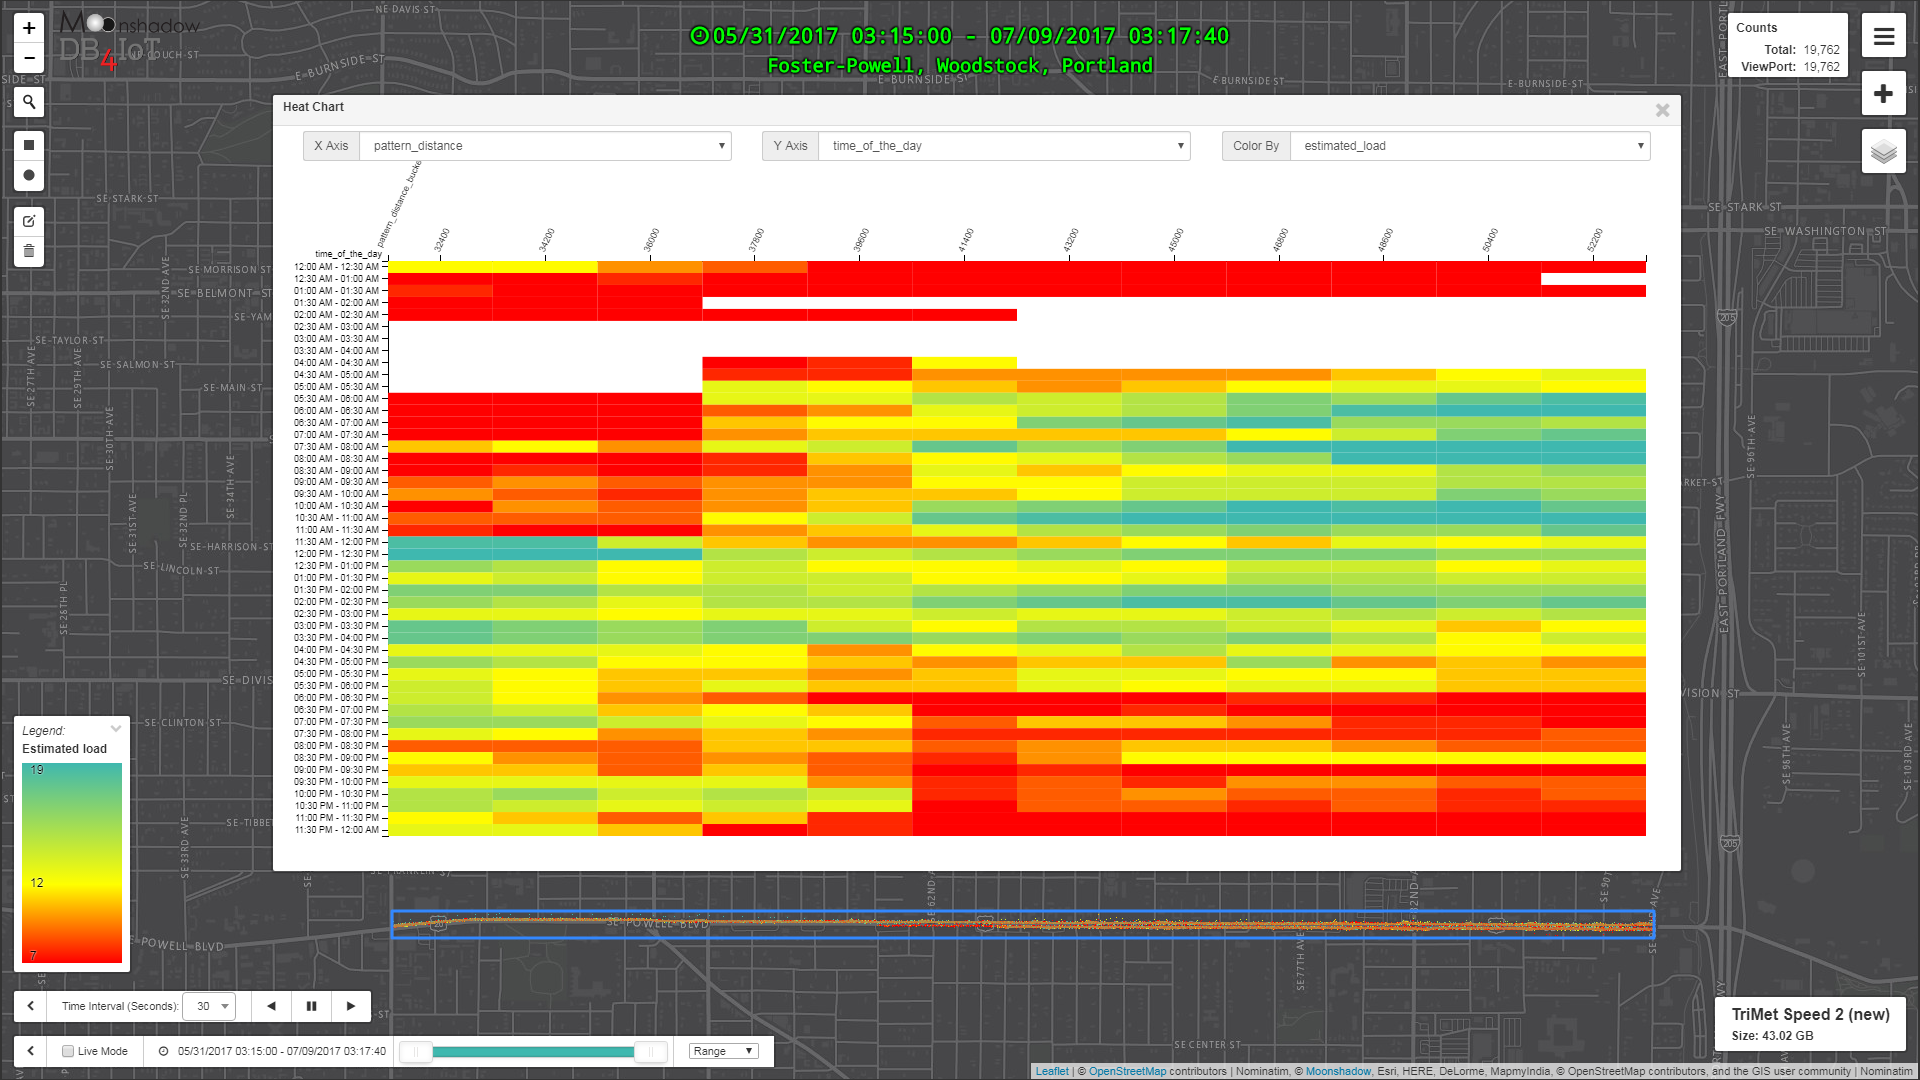
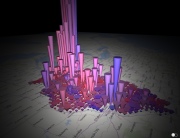
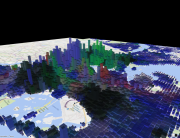
DB4IoT delivers cutting-edge database technology, interactive maps and analytics dashboards for public transit. This image shows the number of passengers on TriMet Bus Route #9 Westbound during Weekdays on Powell from the intersection of Powell and I5 all the way to Powell and 40th. The image was generated automatically from data that was recorded on every bus that ran on weekdays between May 31st 2017 and July 9th 2017. The X-axis shows the distance traveled in feet along Route #9. The Y-axis shows the time of day. The number of passengers is called the “Estimated Load” in TriMet’s lingo. The Estimated load is colored from a low passenger count in red, to a medium passenger count in yellow and a high passenger count in green. This graph instantly shows where along the route during what time periods the number of passengers on Route #9 Westbound were low or high.

