
Project Description
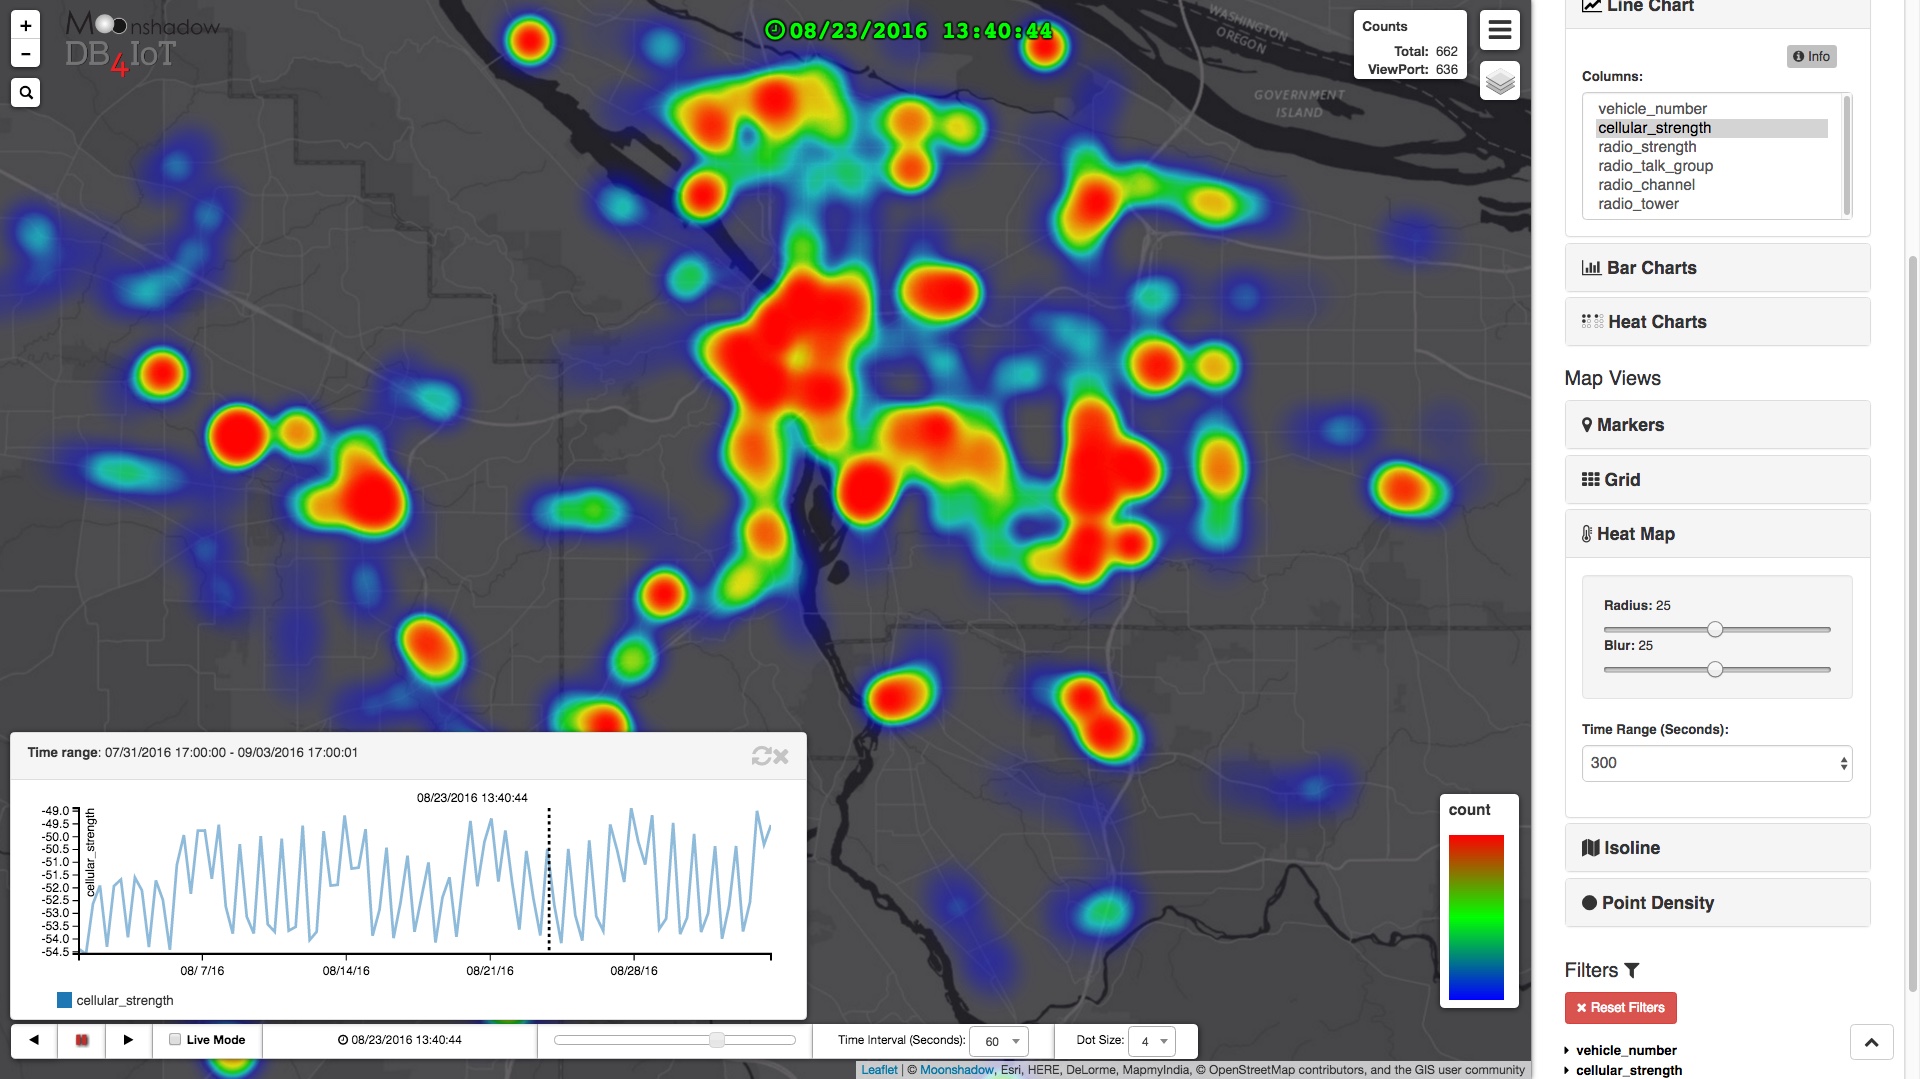
A cellular connectivity heat map screenshot taken from DB4IoT’s interactive public transit data analytics map and animation user interface. The connectivity situation can change minute-by-minute and day-by-day due to several contributing factors including weather, radio interference, the number of active connections to an individual cell tower, equipment automatically switching from one tower to another, overall network congestion, additions or reductions to the capacity of certain towers, various network changes implemented by cellular carriers and other factors. DB4IoT makes it fast and easy to analyze these changes.