
Stellar Services, Arup and Moonshadow team up to address an urgent need
Departments of Transportation (DOTs) maintain their road network information in GIS systems. Connected Vehicle (CV) data gives us detailed information on how the road network is used. DOTs, therefore, have a need to combine road usage information from CV data with the road network information in their GIS system.
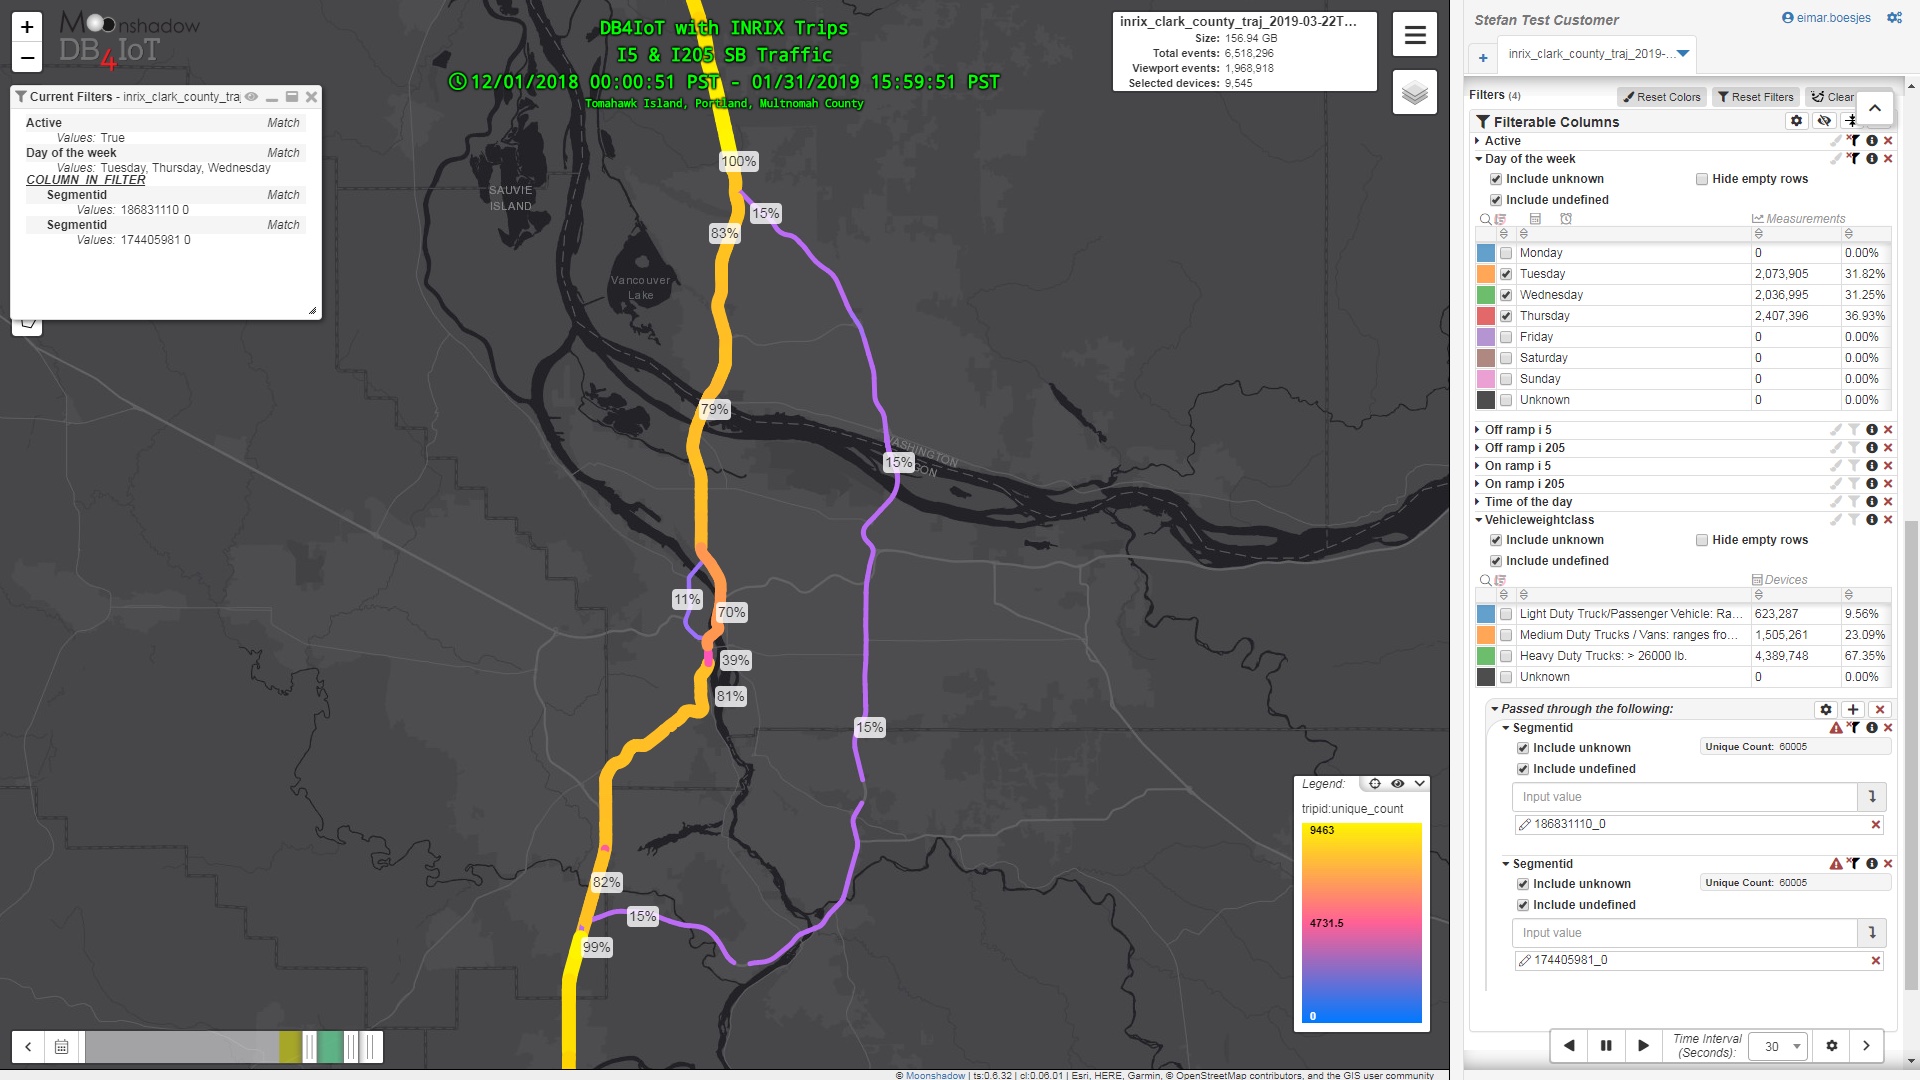
As vehicles are driving they send an update to the cloud every few seconds to generate a sequence of ‘breadcrumbs’ or waypoints for every trip. Data from millions of trips is combined to generate datasets with billions of waypoints to analyze road network use in an area over time. GIS systems can’t work with billions of waypoints. To ingest, store and analyze billions of waypoints you need specialized database technology such as Moonshadow’s DB4IoT (the DataBase for the Internet of Things). GIS systems need the information summarized per road segment and time bracket. Generating time-binned road segment level information in a GIS system from billions of waypoints, however, is a time-consuming process that requires sophisticated data processing and GIS skills as well as significant server resources.
Stellar Services, Arup and Moonshadow have teamed up to address this need and we are introducing the Waypoints GIS Connector. The Waypoints GIS Connector will take in waypoint data from connected vehicles, fleet software and mobile apps and match these to the road network from the GIS system. The enriched waypoint data is stored in DB4IoT and the Waypoints GIS Connector can use the DB4IoT API’s to pull out information per road segment and time period. Once the data has been reduced to time-binned road segment level information it can be saved in a GeoDatabase that can be accessed in ArcGIS and other GIS systems. The GIS Connector can work with historic datasets as well as real-time data feeds; with the GIS connector DOTs can automatically update their GIS systems with road use information in real time!
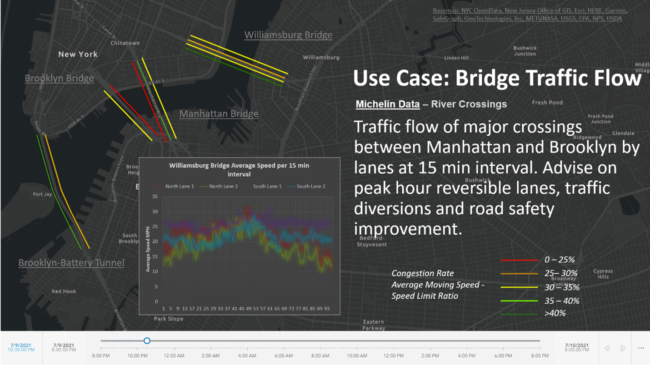
Both Stellar and Arup are ESRI Silver developers and can create custom dashboards inside of ArcGIS to a DOTs needs. The above animated GIF shows how Arup engineers visualized congestion around a Mets game at Citi Field inside of ArcGIS over time. In the image below Arup used Michelin data to analyze the bridge traffic flow across the East River in New York City over 15-minute intervals in ArcGIS to advise on peak hour lane reversions.
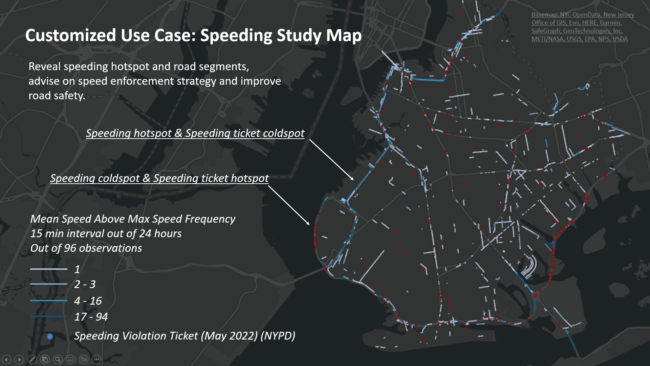
The use cases are not limited to traffic speed and volume. When the road network and movement data is combined with other sources of data completely new insights can be derived. In the following example Arup combined CV data with NYC speeding ticket data to compare speeding locations and times with speeding ticket locations and times to create a Speeding study map in ArcGIS. The map shows when and where speed enforcement should concentrate their efforts.
The17-state Eastern Transportation Coalition (TETC) has approved the Waypoints GIS Connector as part of our Stellar Waypoints offering in the Traffic Data Marketplace (TDM) to make it easier for agencies to procure the GIS Connector. For more information visit the Stellar Waypoints website here. The Waypoints GIS Connector works anywhere in the world. Outside the ETC region the Waypoints GIS Connector can be procured directly from Moonshadow.
Stellar, Arup and Moonshadow will host a webinar about the Waypoints GIS Connector on Thursday January 19 at 2PM ET.
Please contact wander@moonshadow.com for more information about the Waypoints GIS Connector.


