There are three types of points in the INRIX Trips data; Origin points, Waypoints and Destination points. Trips start at an origin point, generate data at a number of waypoints and end at a destination point. In DB4IoT with INRIX Trips you can select all waypoints on a specific road and generate an Origin-Destination Matrix for all trips passing through that road. In addition, the platform provides routing information (via waypoints) that visualize the route that was used by a trip.
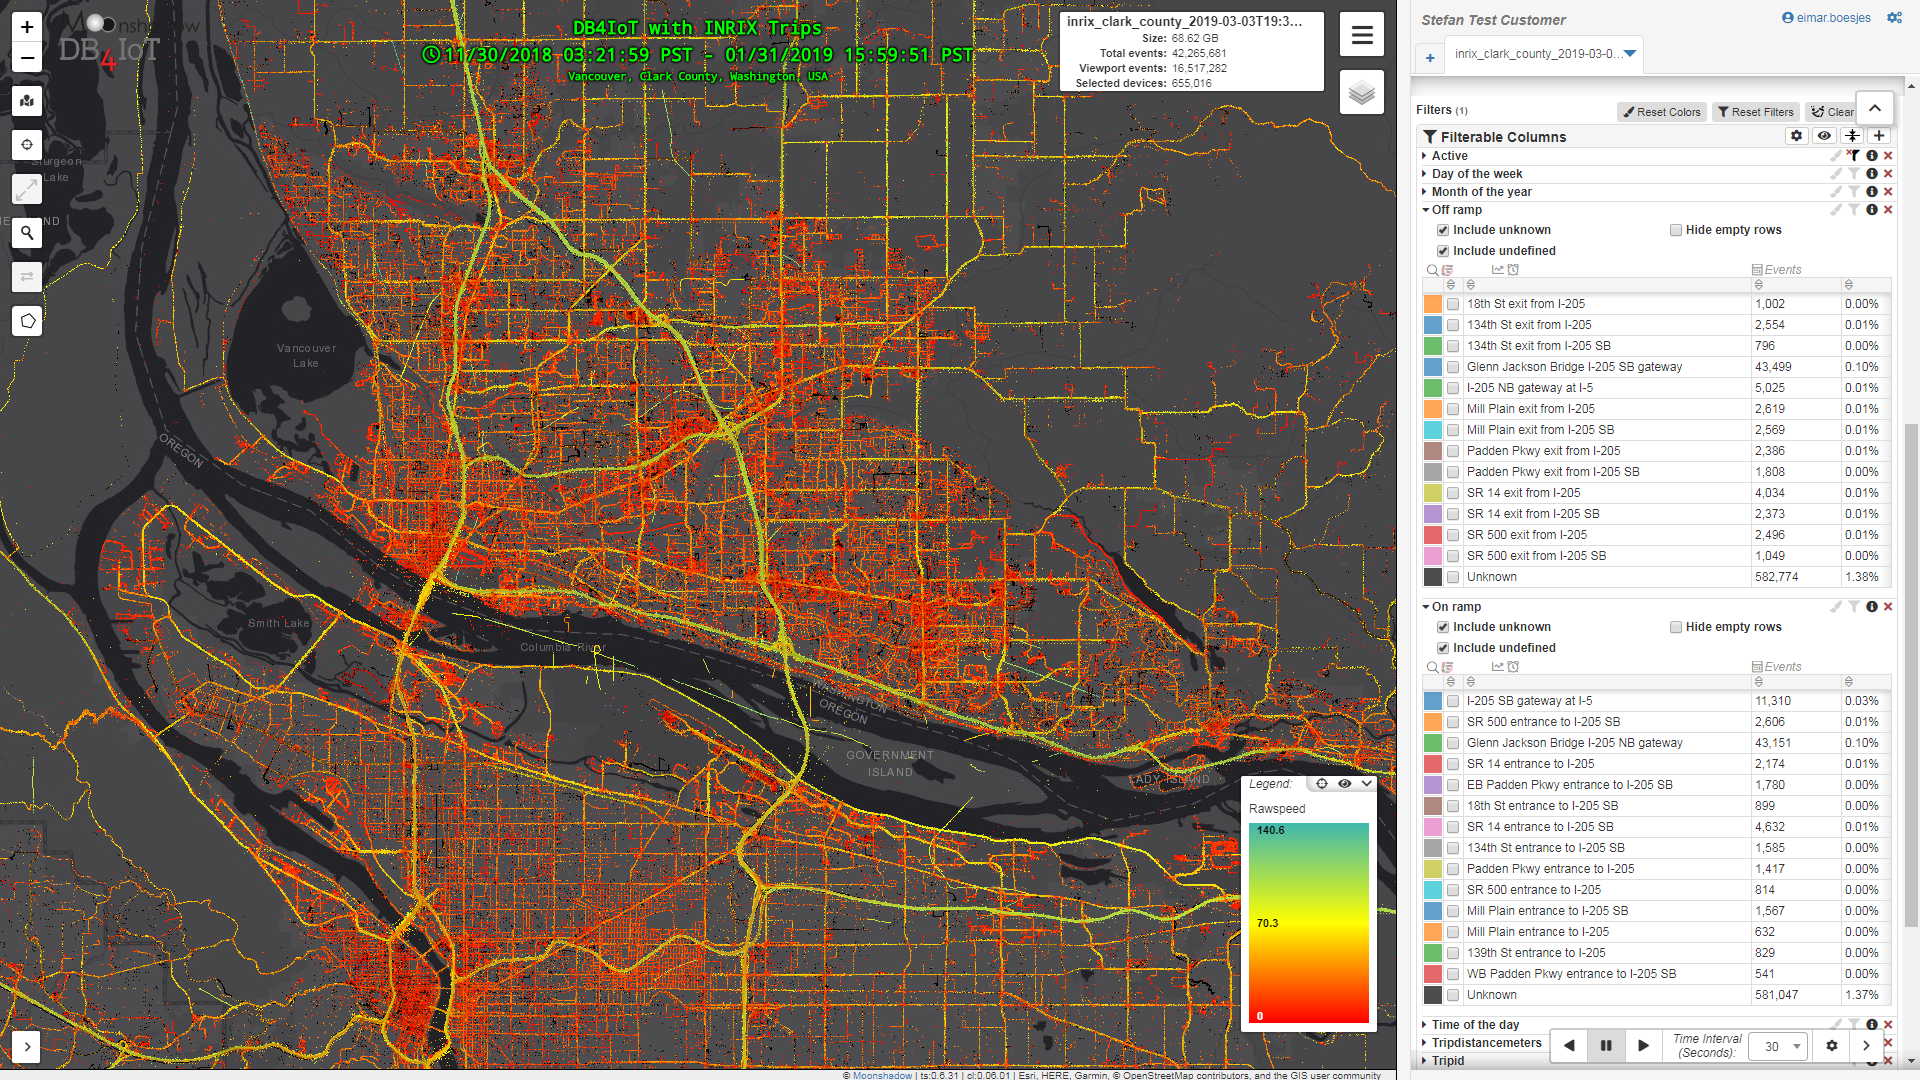
Figure 1. DB4IoT with INRIX Trips – I-205 On-ramps and Off-ramps are selectors in the side panel
Data shown is for demonstration purposes only
If you manage a freeway system you are interested in trip routing details, rather than simply the origins and destinations of the trips. For instance, you may want to know when and where vehicles entered your freeway system and when and where they exited the freeway. This data helps to better understand travel patterns on the freeway – where a significant weave may occur or where an auxiliary lane may provide benefit. Freeway operators and planners have a need to generate O/D matrices from on-ramp to off-ramp. We recently created this functionality in DB4IoT with INRIX Trips for a project in Clark County (WA) where DKS Associates, a traffic engineering firm from Portland, OR, is using DB4IoT with INRIX Trips.
For this project DKS identified all the on-ramps (entry points) and off-ramps (exit points) for Interstate 205 (I-205) in Clark County, WA. The entry point where I-205 crossed into Clark County was also marked as an entry point. Exit points where I-205 crossed out of Clark County were marked as off-ramps. Two columns were added to DB4IoT; a column for on-ramps and one for off-ramps. These columns are shown in the DB4IoT user interface and operate in the same way as any other filterable attributes. With a single mouse click you can choose to look only at trips that passed through a specific on-ramp or off-ramp. On-ramp and off-ramp filters can be combined with any other filters such as the Day of the Week, Time of Day, Vehicle Weight Class etc.
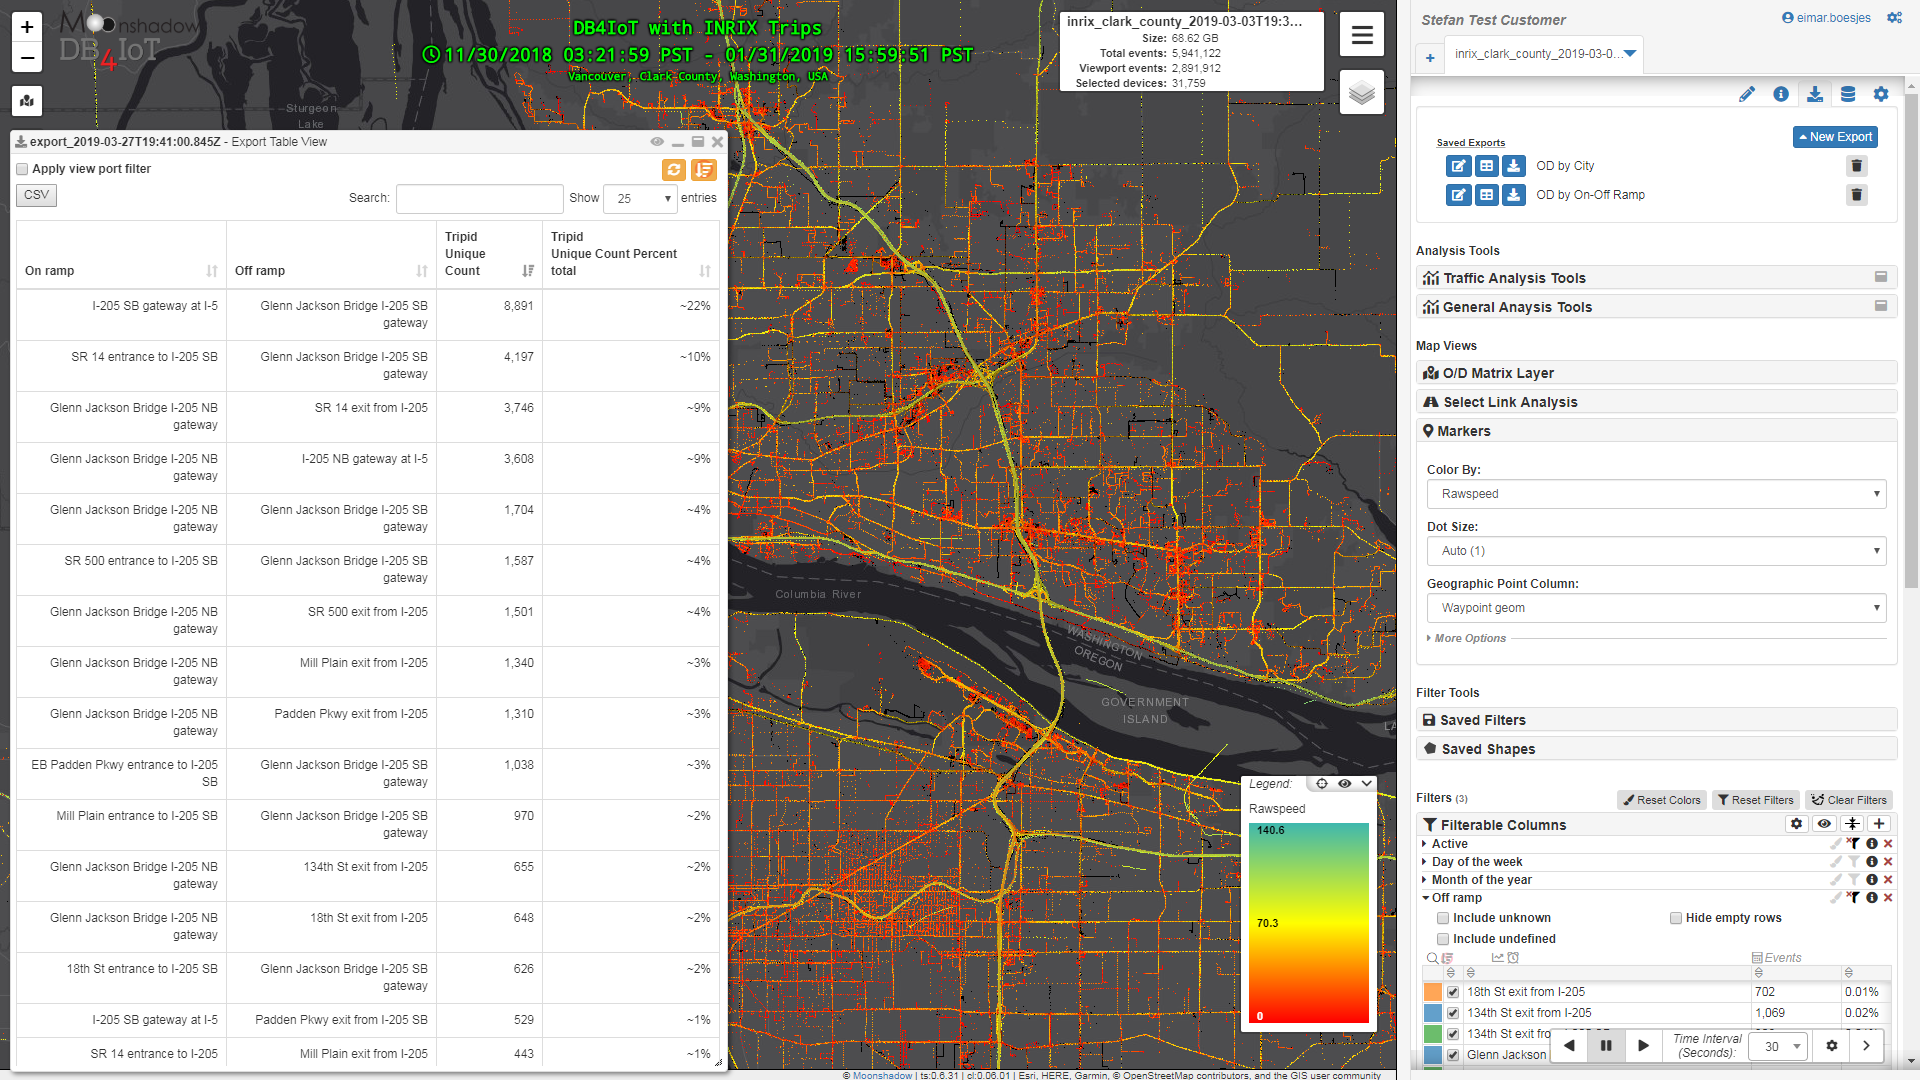
Figure 2. On-ramp to Off-ramp Origin-Destination Pairs.
Data shown is for demonstration purposes only
With a few clicks you can generate on-ramp to off-ramp Origin-Destination pairs as shown in Figure 2. Generation of these ‘Freeway’ O/D pairs usually takes just a few seconds. O/D pair data can be exported as a CSV for use in Excel. DB4IoT can also generate the ‘Freeway O/D Matrix’.
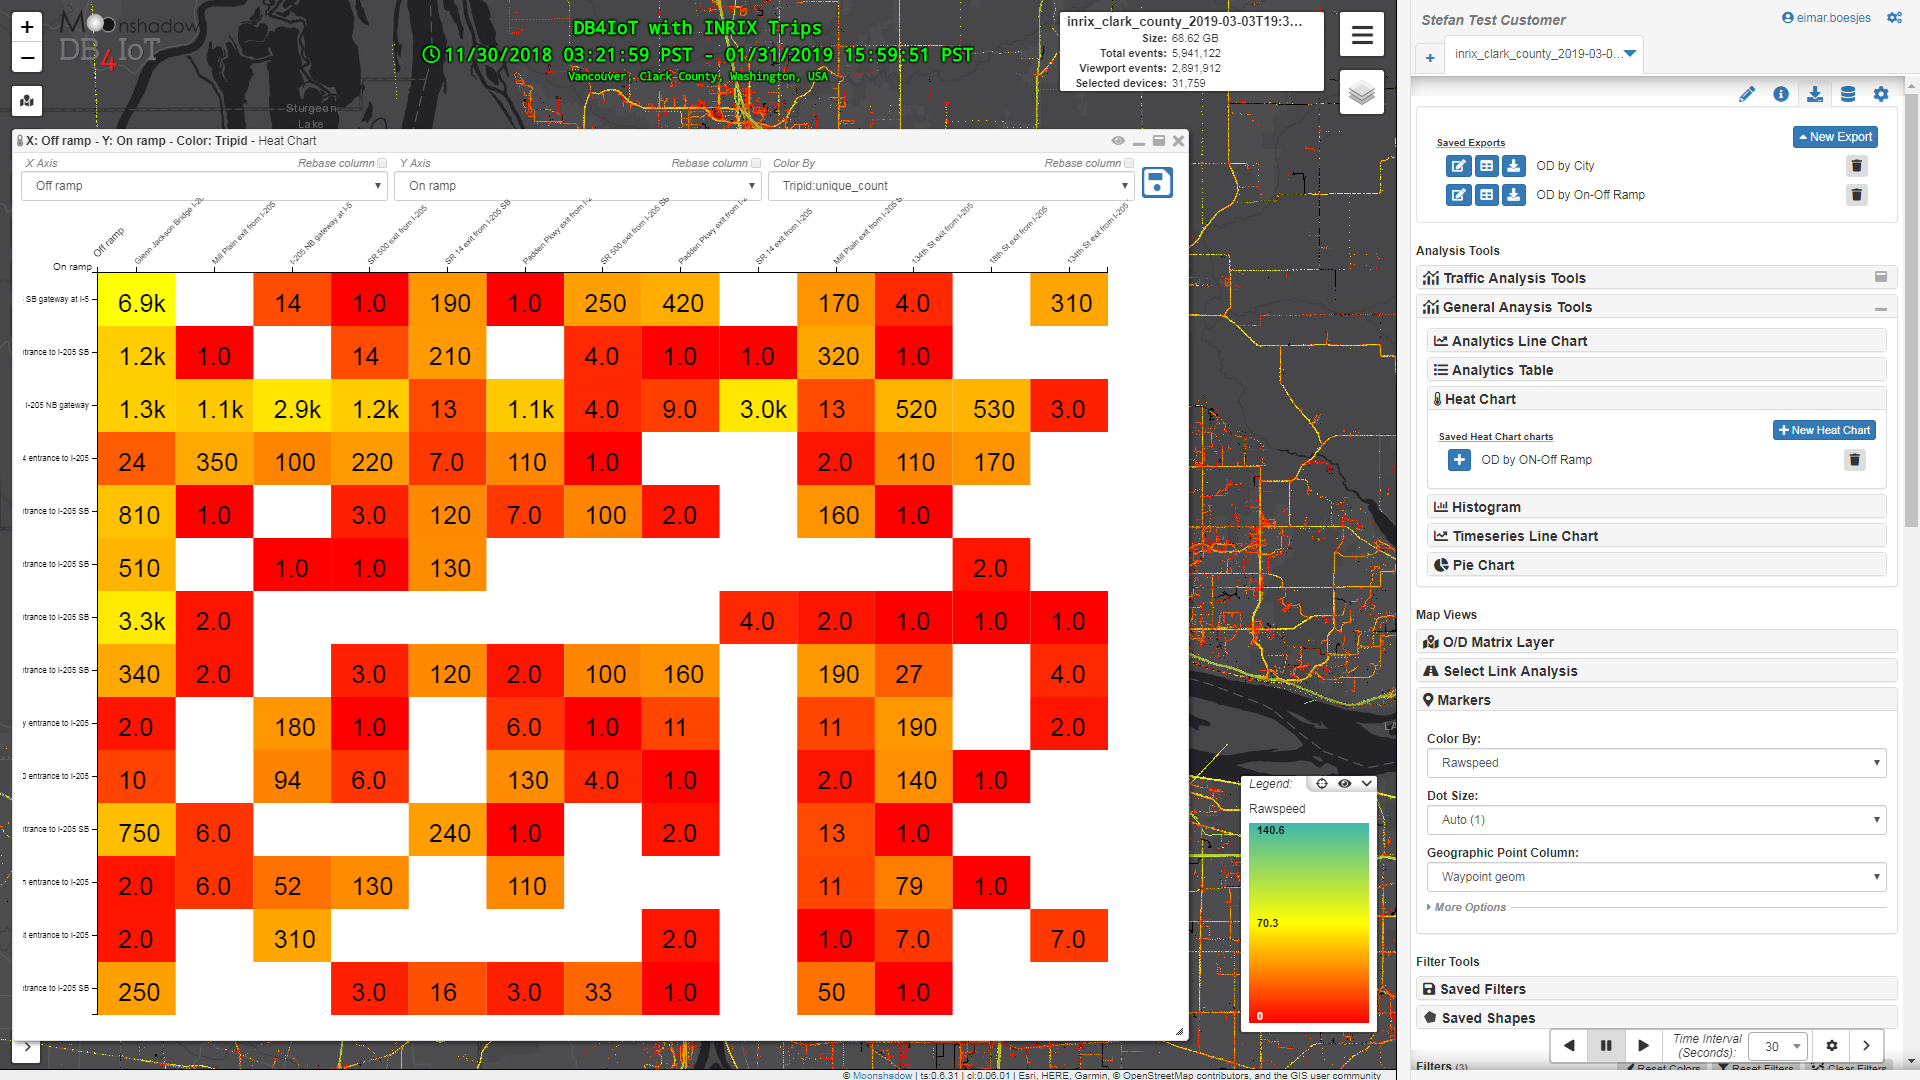
Figure 3. Freeway Origin-Destination Matrix from On-ramp to Off-ramp
Data shown is for demonstration purposes only
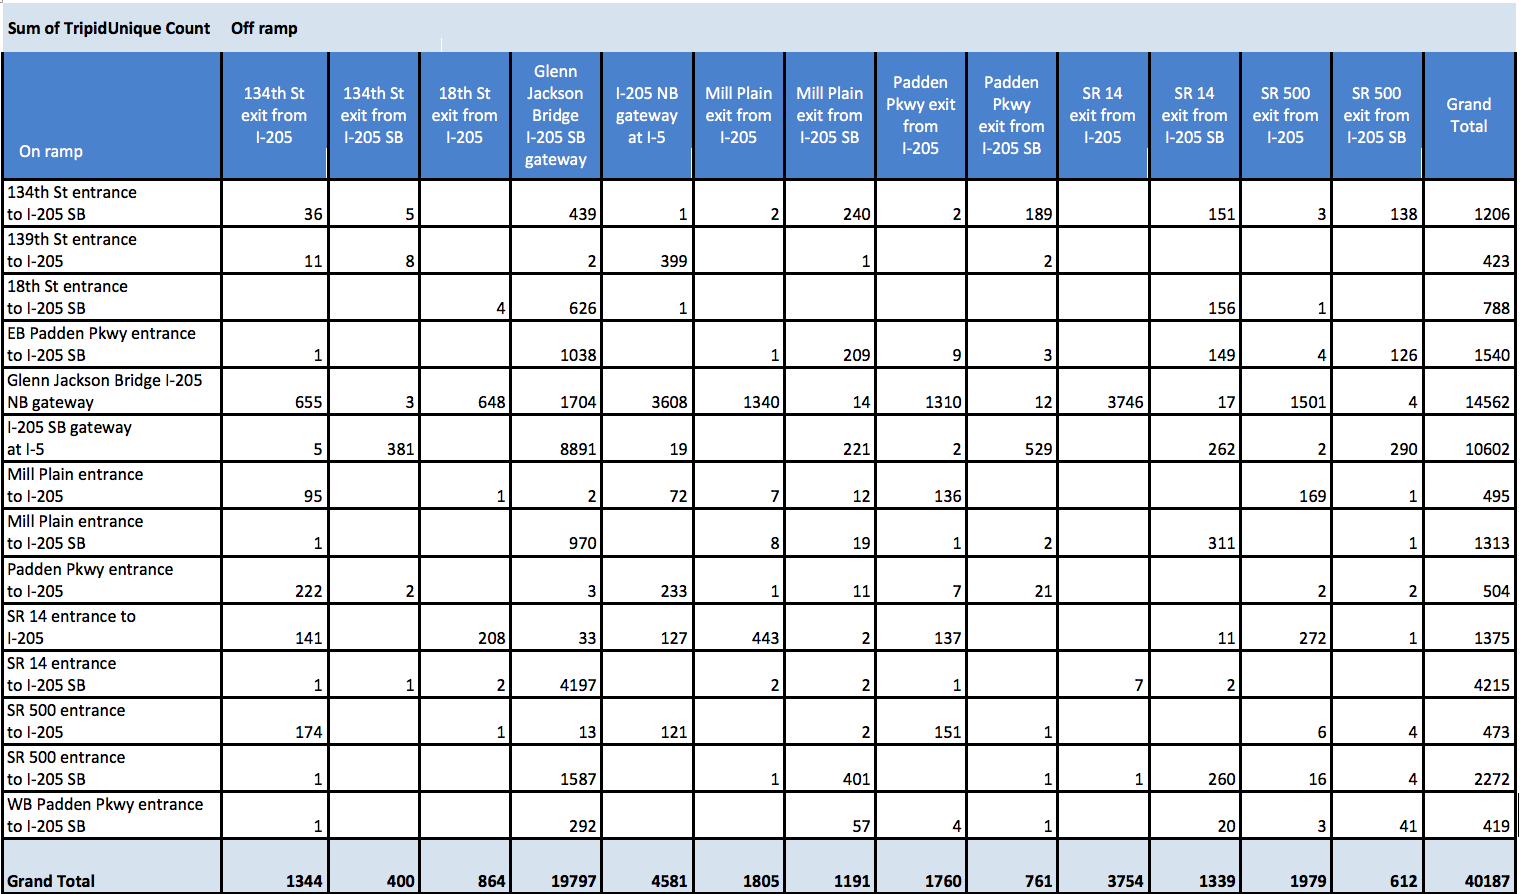
Figure 4. Freeway Origin-Destination Matrix from On-ramp to Off-ramp in Excel
Data shown is for demonstration purposes only
We can refine the data and look at detailed traffic patterns. The example below shows all traffic that entered Clark County over the Glenn Jackson Bridge and exited on Mill Plains Blvd on Tuesday-Thursday.
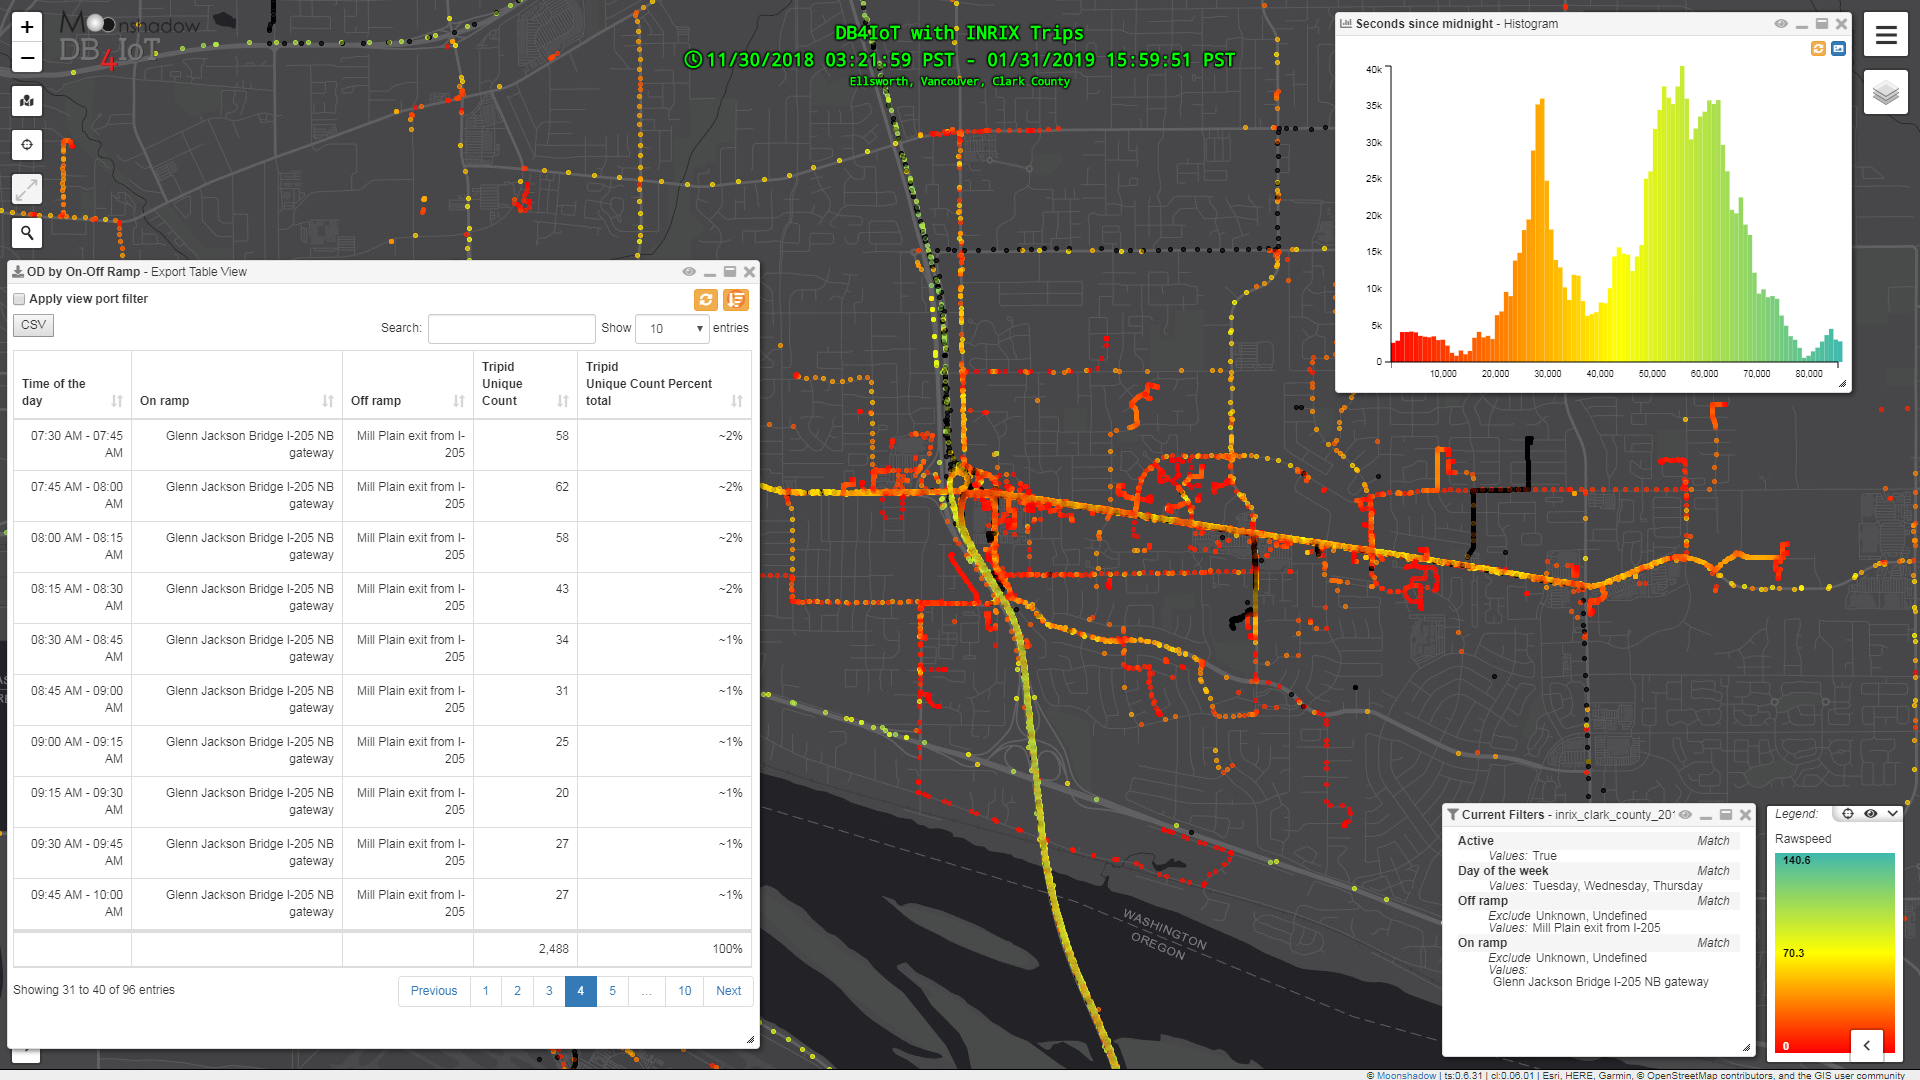
Figure 5. Glenn Jackson Bridge to Mill Plains Blvd Exit Traffic over the Time of Day
Data shown is for demonstration purposes only
The histogram in the top right corner shows the distribution of the traffic over the day. The morning peak, shown in orange, is brief, while the evening peak, shown in light green, has a longer duration. The Mills Plain exit gives access to a residential area and many residents work south of the river and commute back in the evening. The table shows the counts (samples) per 15 minute increments. This data can be exported to a spreadsheet for further analysis with a few more clicks.
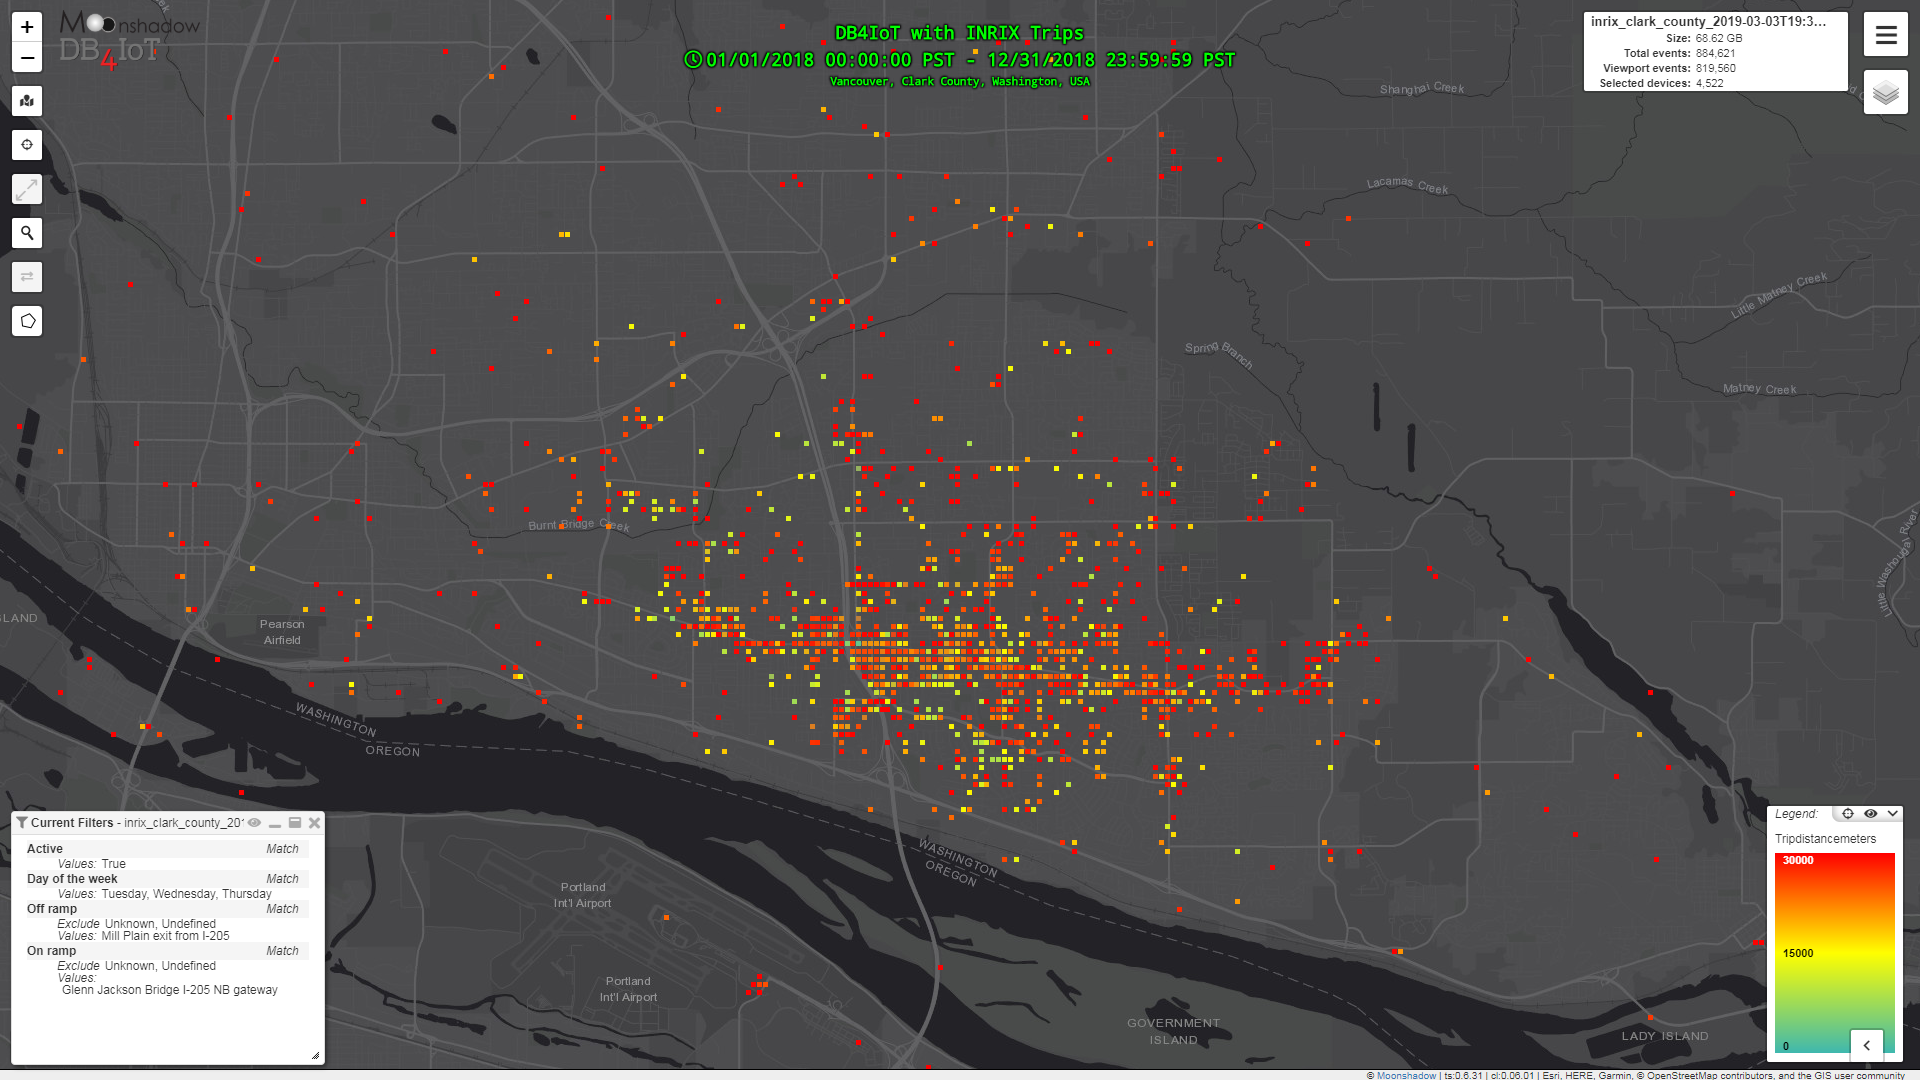
The above image shows the destinations of trips that entered Clark County on I-205 on the Glenn Jackson Bridge and exited on Mills Plains Blvd Tuesdays through Thursdays in 2018. The destinations are colored by the length of the trip.
This use case shows that DB4IoT with INRIX Trips can now be used to generate Freeway O/D matrices interactively.

