
The NYC Open Data portal provides an interesting and useful data set from the NYPD that is a breakdown of every collision in NYC by location and injury. This data is manually run every month and reviewed by the TrafficStat Unit before being posted on the NYPD website. Each record represents a collision in NYC by city, borough, precinct and cross street. This data can be used by the public to see how dangerous/safe intersections are in NYC.
We imported the data into DB4IoT, our time-series database engine and analytics platform for the Internet of Moving Things, to visualize the six-year period from July 2012 through June 2018. The following series of images detail the results. Public data sets such as this can be combined in DB4IoT along with transportation data from INRIX, GTFS public-transit feeds, CAD/AVL feeds etc. to give planners and traffic engineers a more comprehensive big picture.
1.3 Million Collisions in Six Years
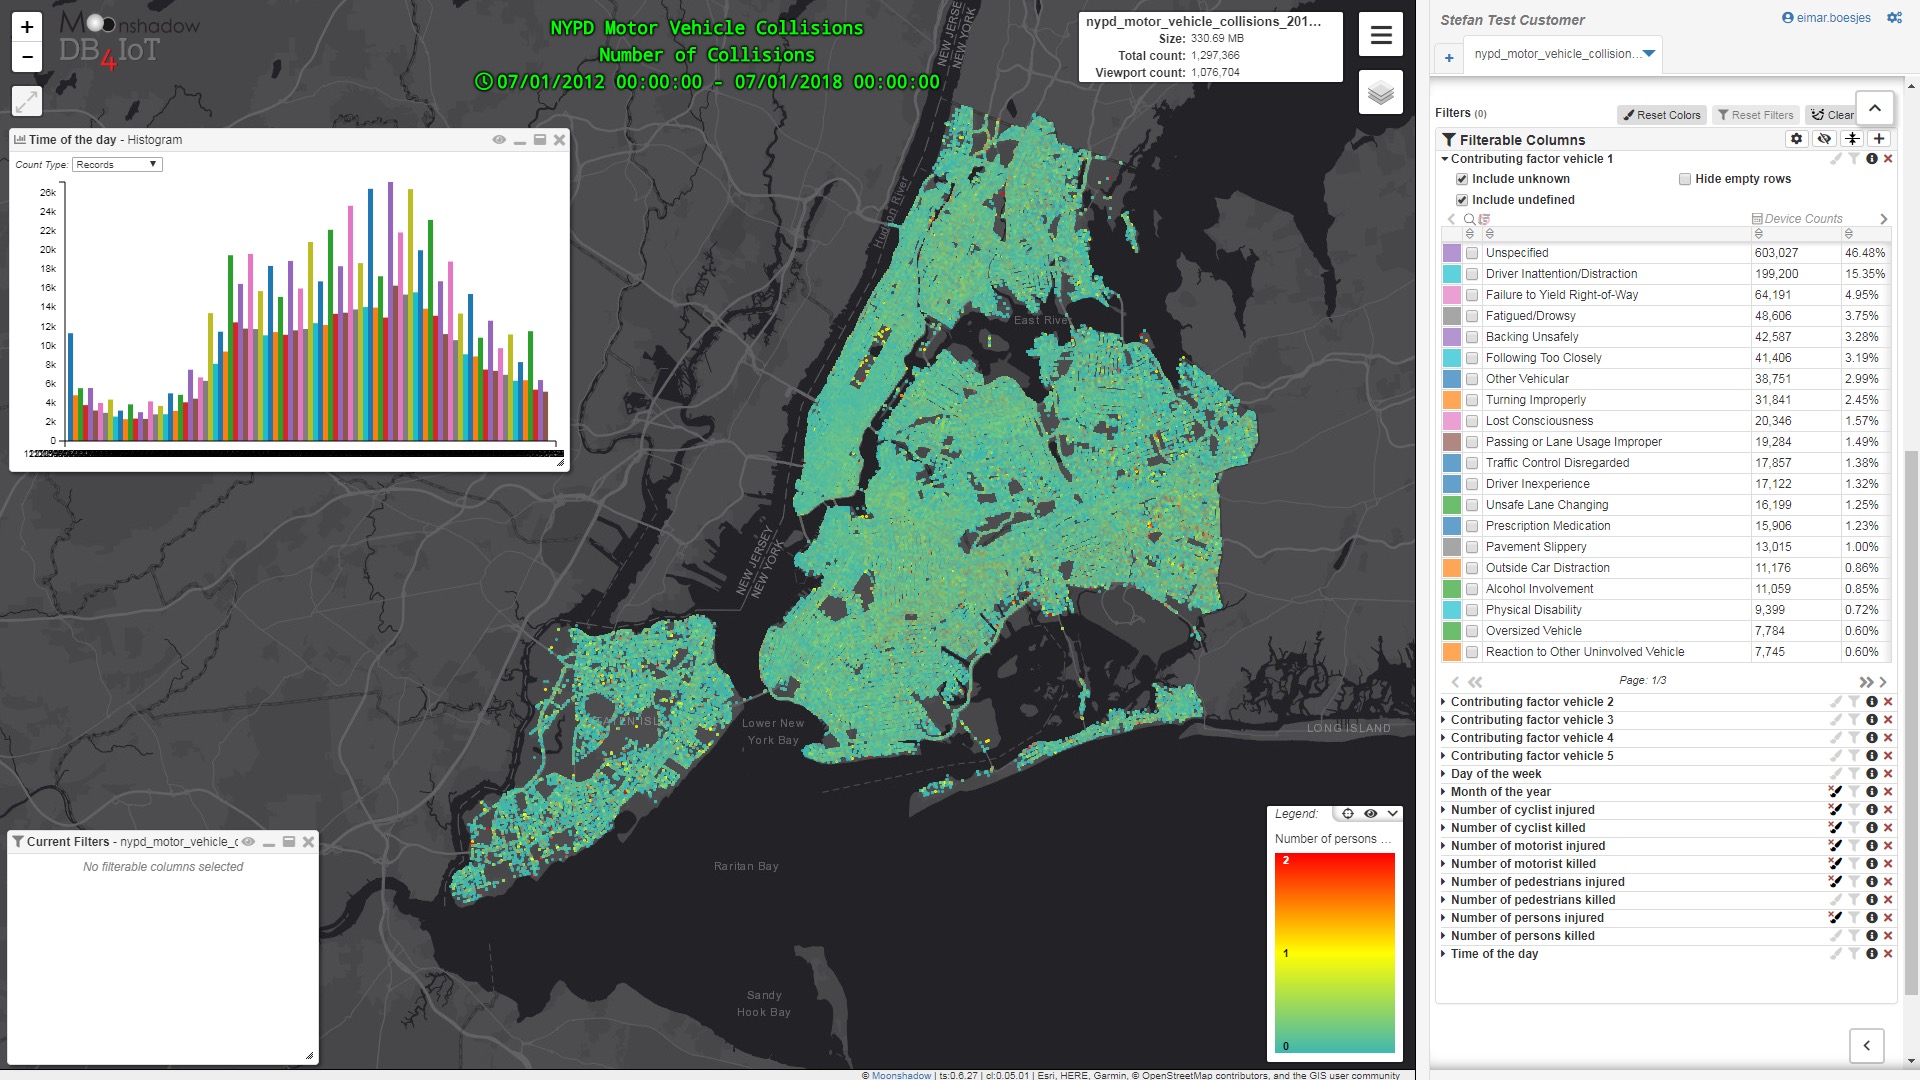
The histogram shows the distribution by time of day.
243,000 Collisions with Injuries
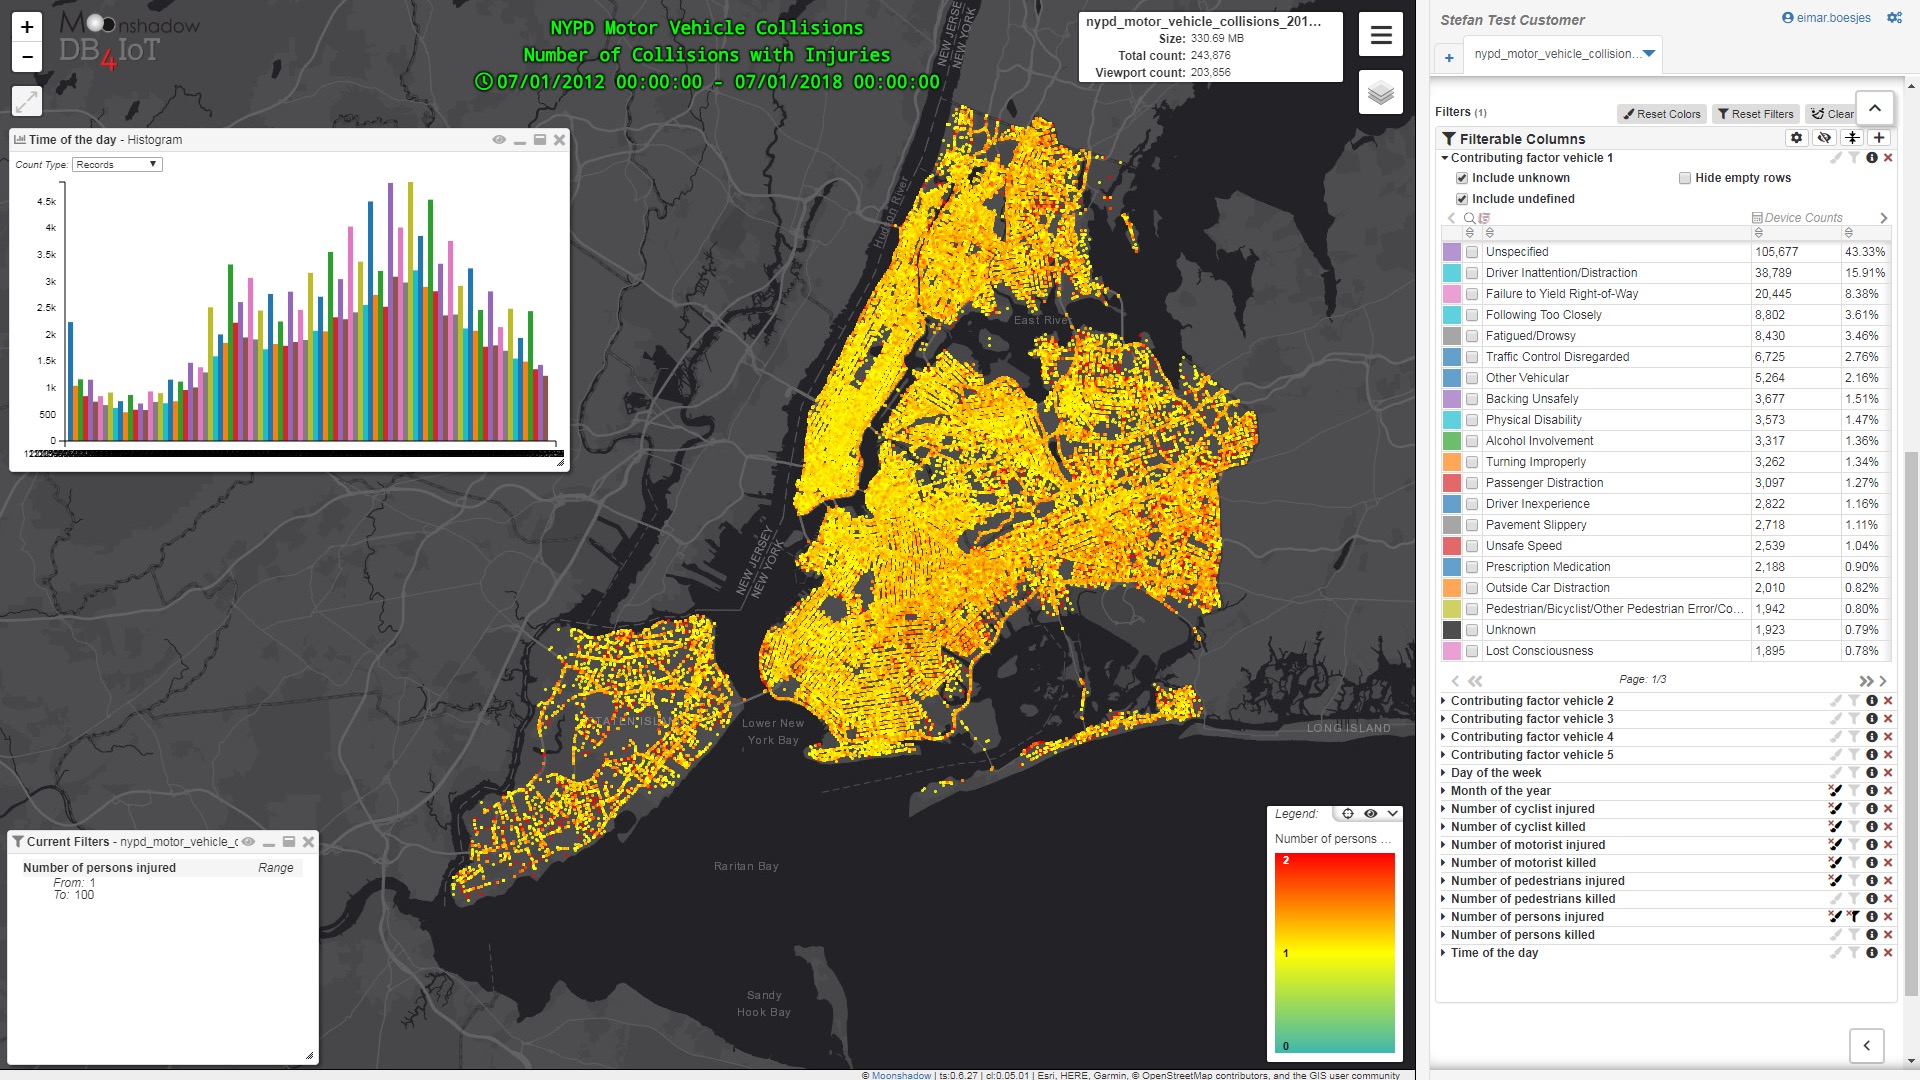
Histogram: collisions track activity patterns during the day
3,317 Injury Collisions with Alcohol Involvement
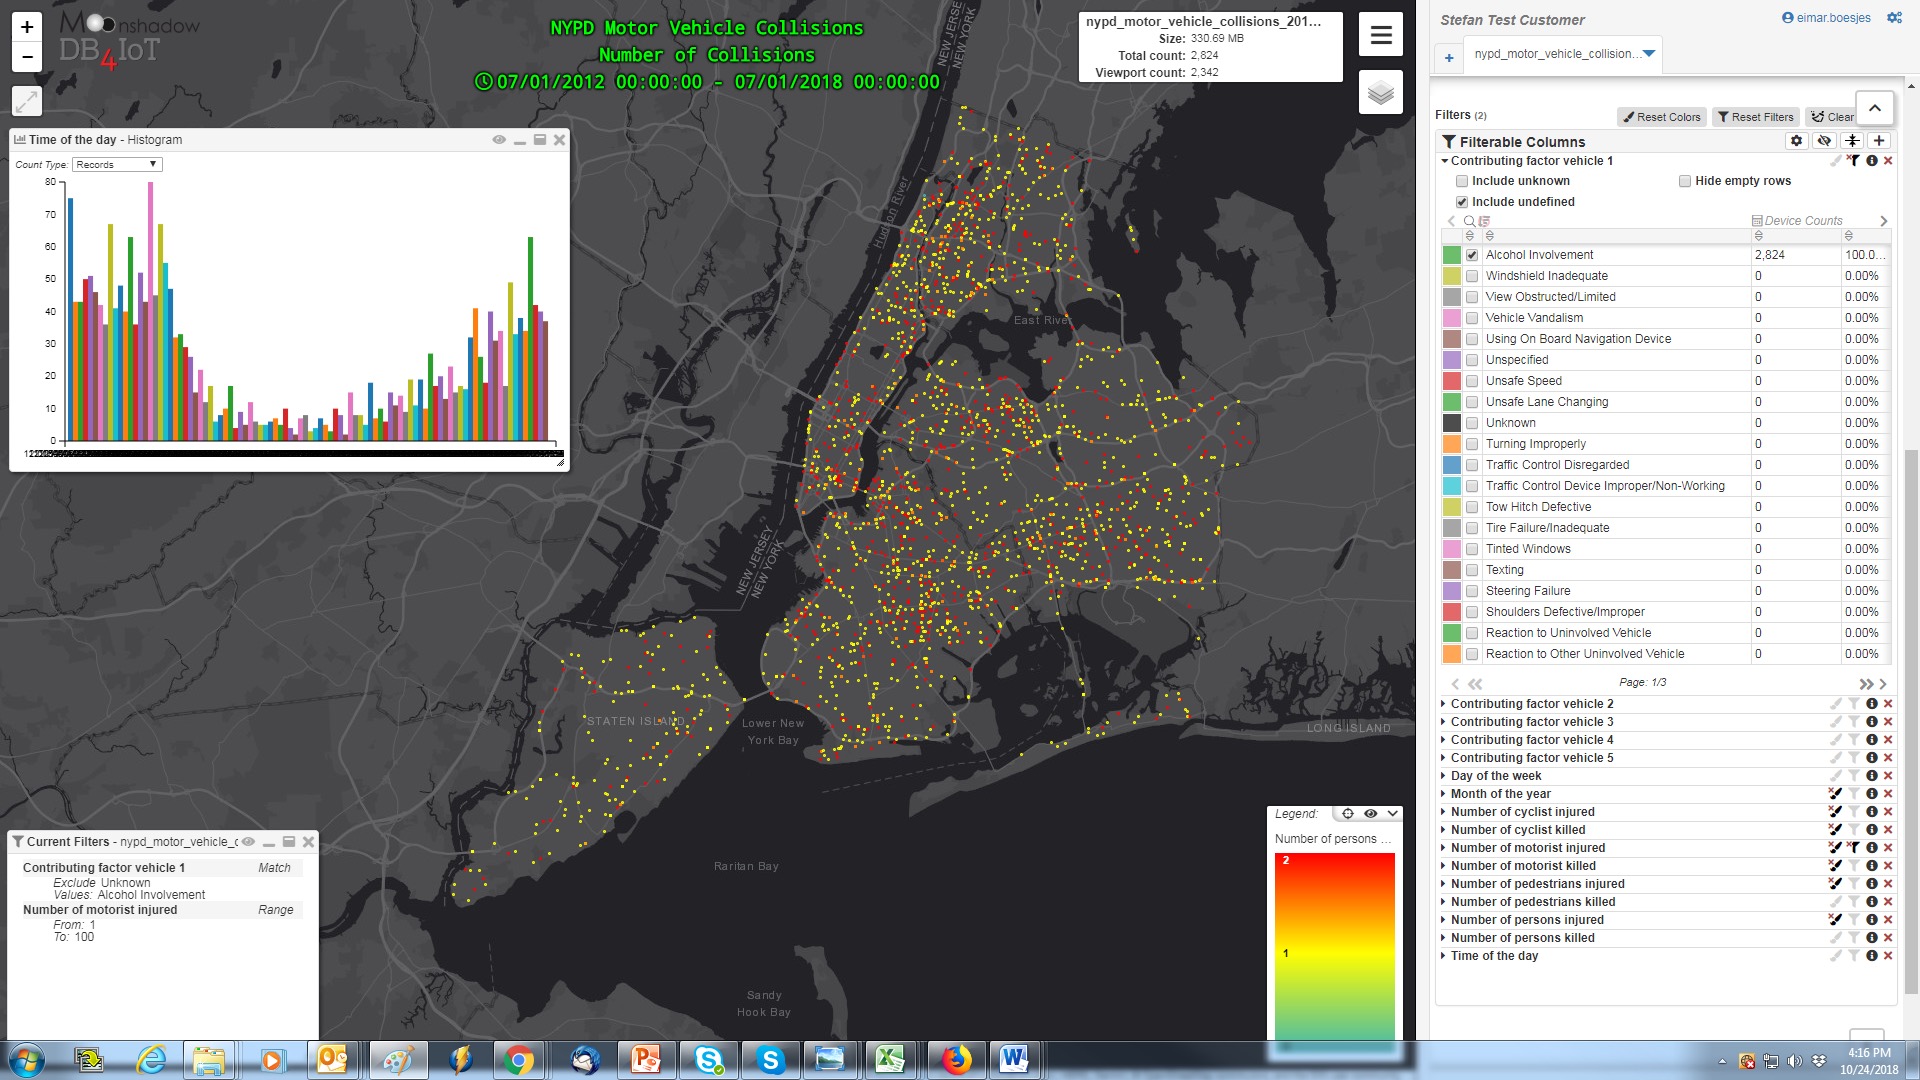
Histogram: many more alcohol-related collisions take place at night
155,000 Collisions with Injured Motorists
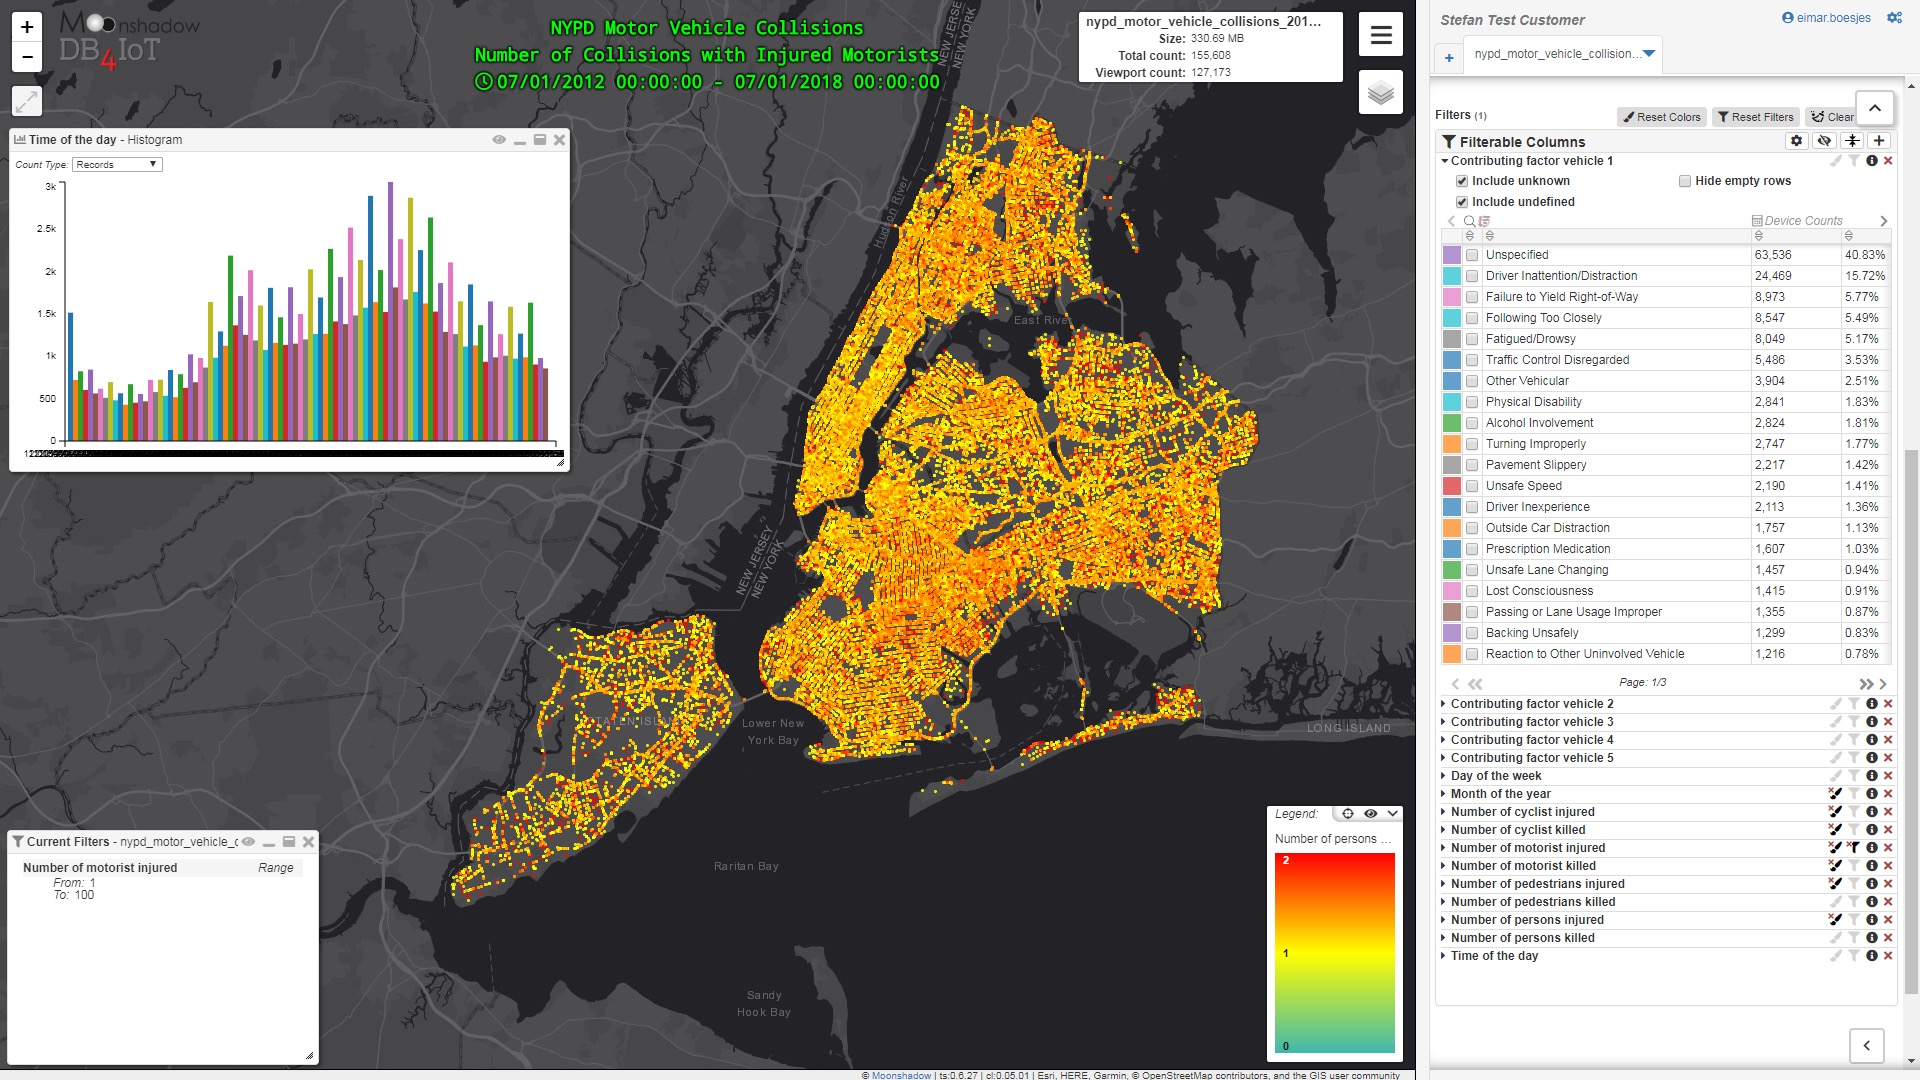
Histogram: driving at night is relatively more injury prone
25,000 Collisions with Injured Cyclists
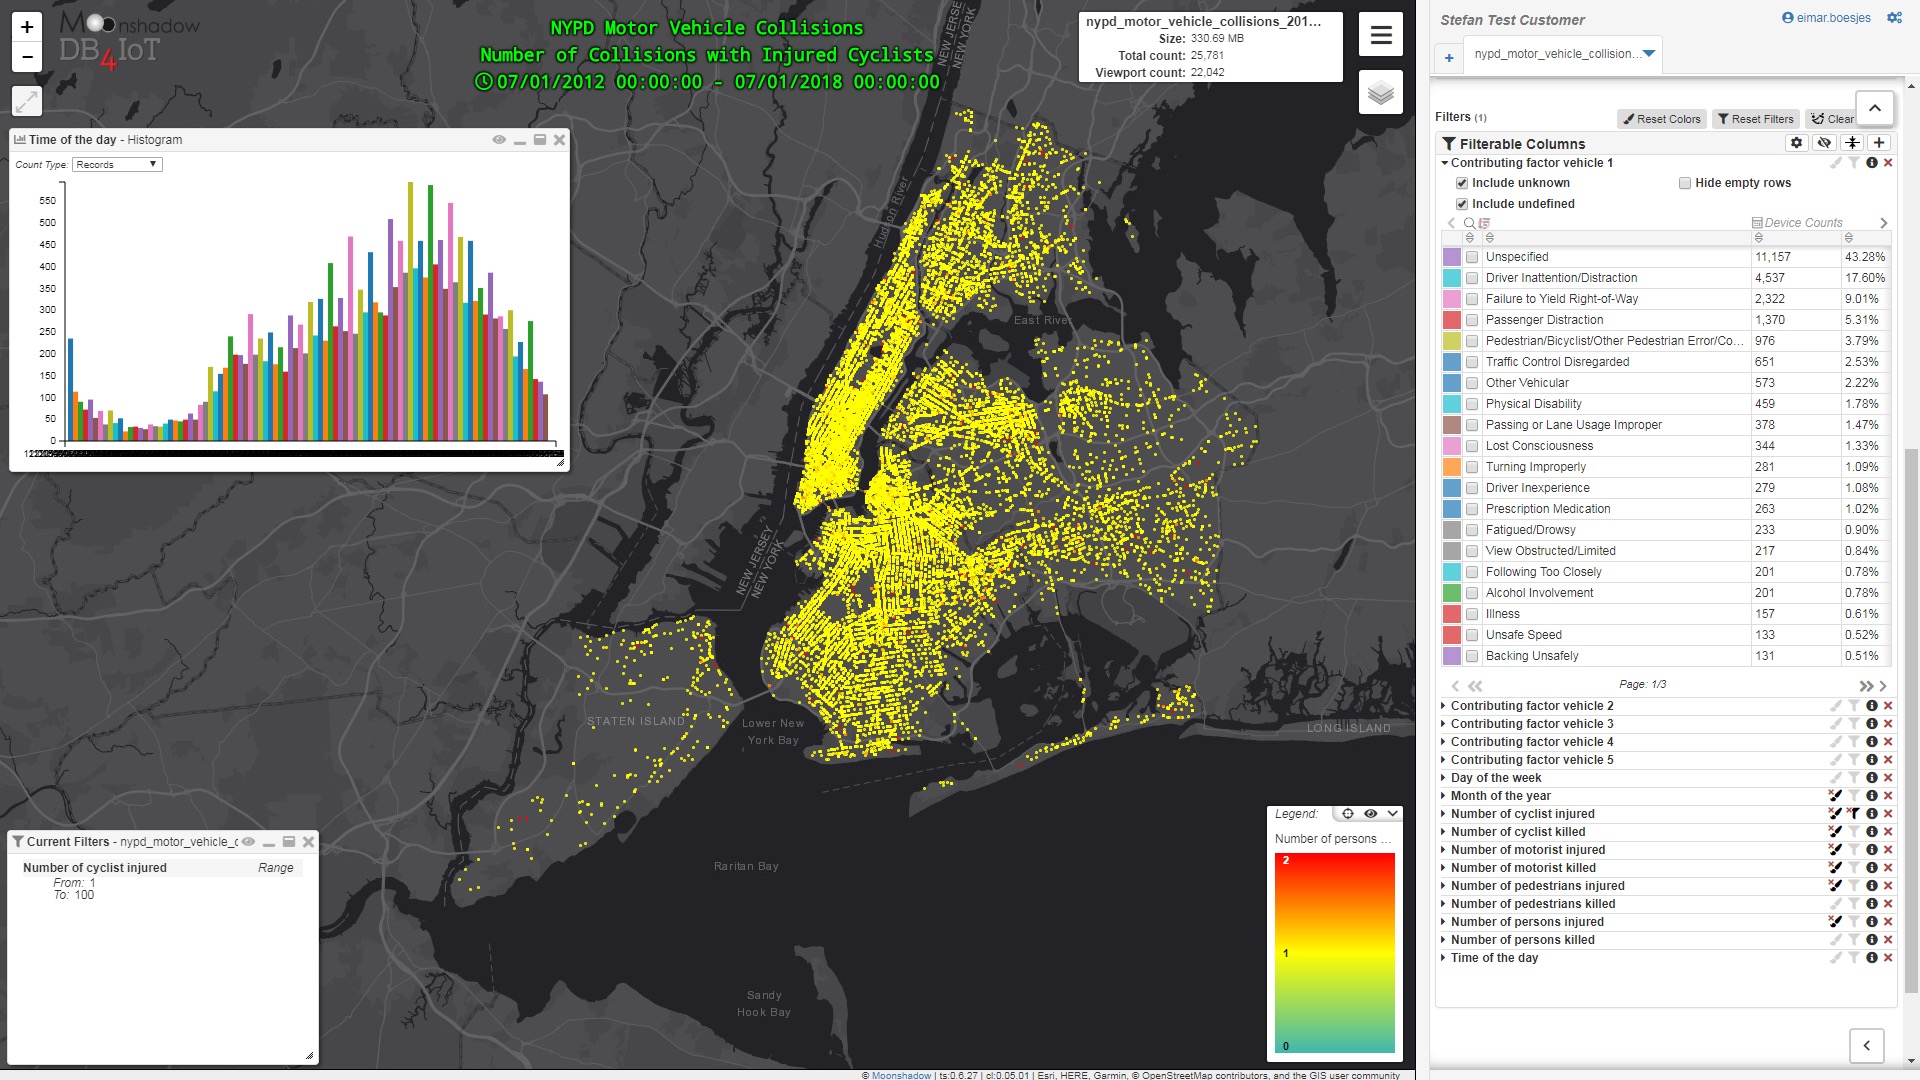
Given there are fewer cyclists, cycling is relatively dangerous
65,000 Collisions with Injured Pedestrians
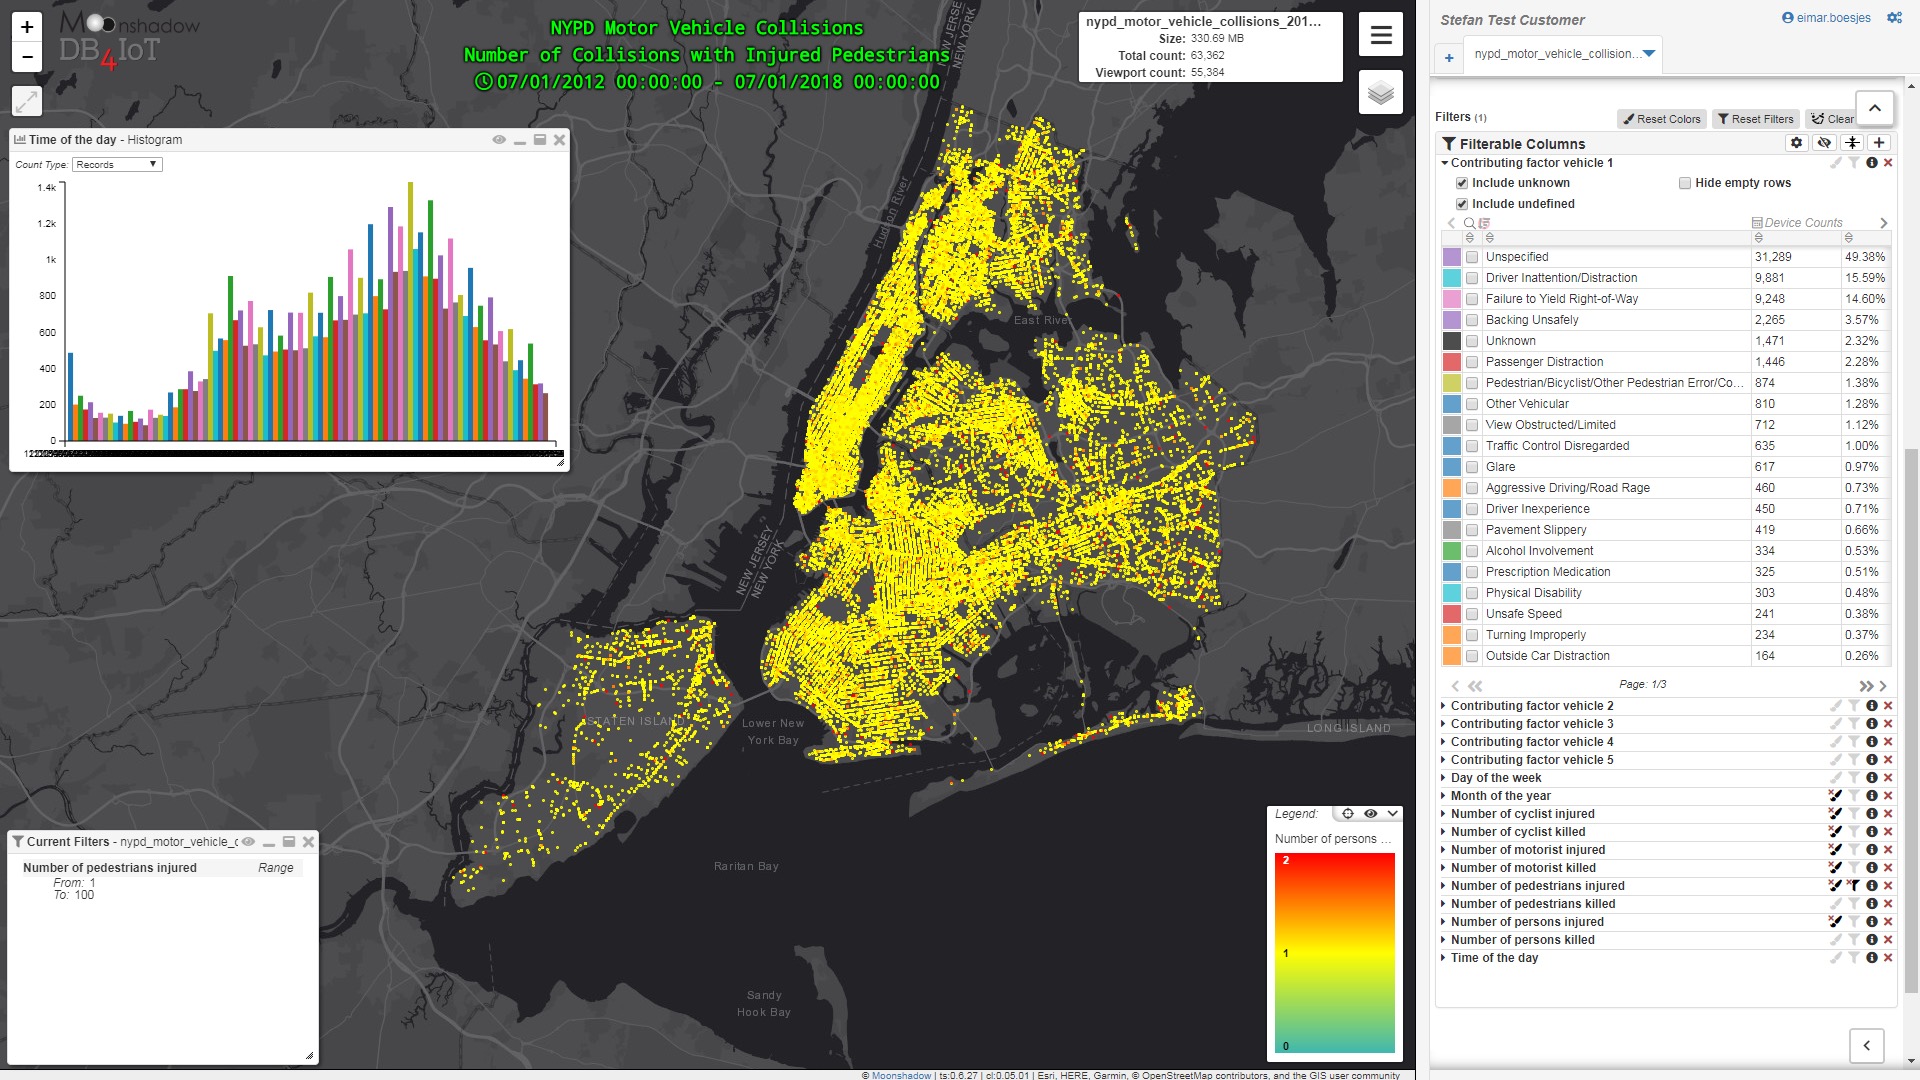
Walking and public transit are less dangerous than driving
538 Collisions with Motorist Fatalities
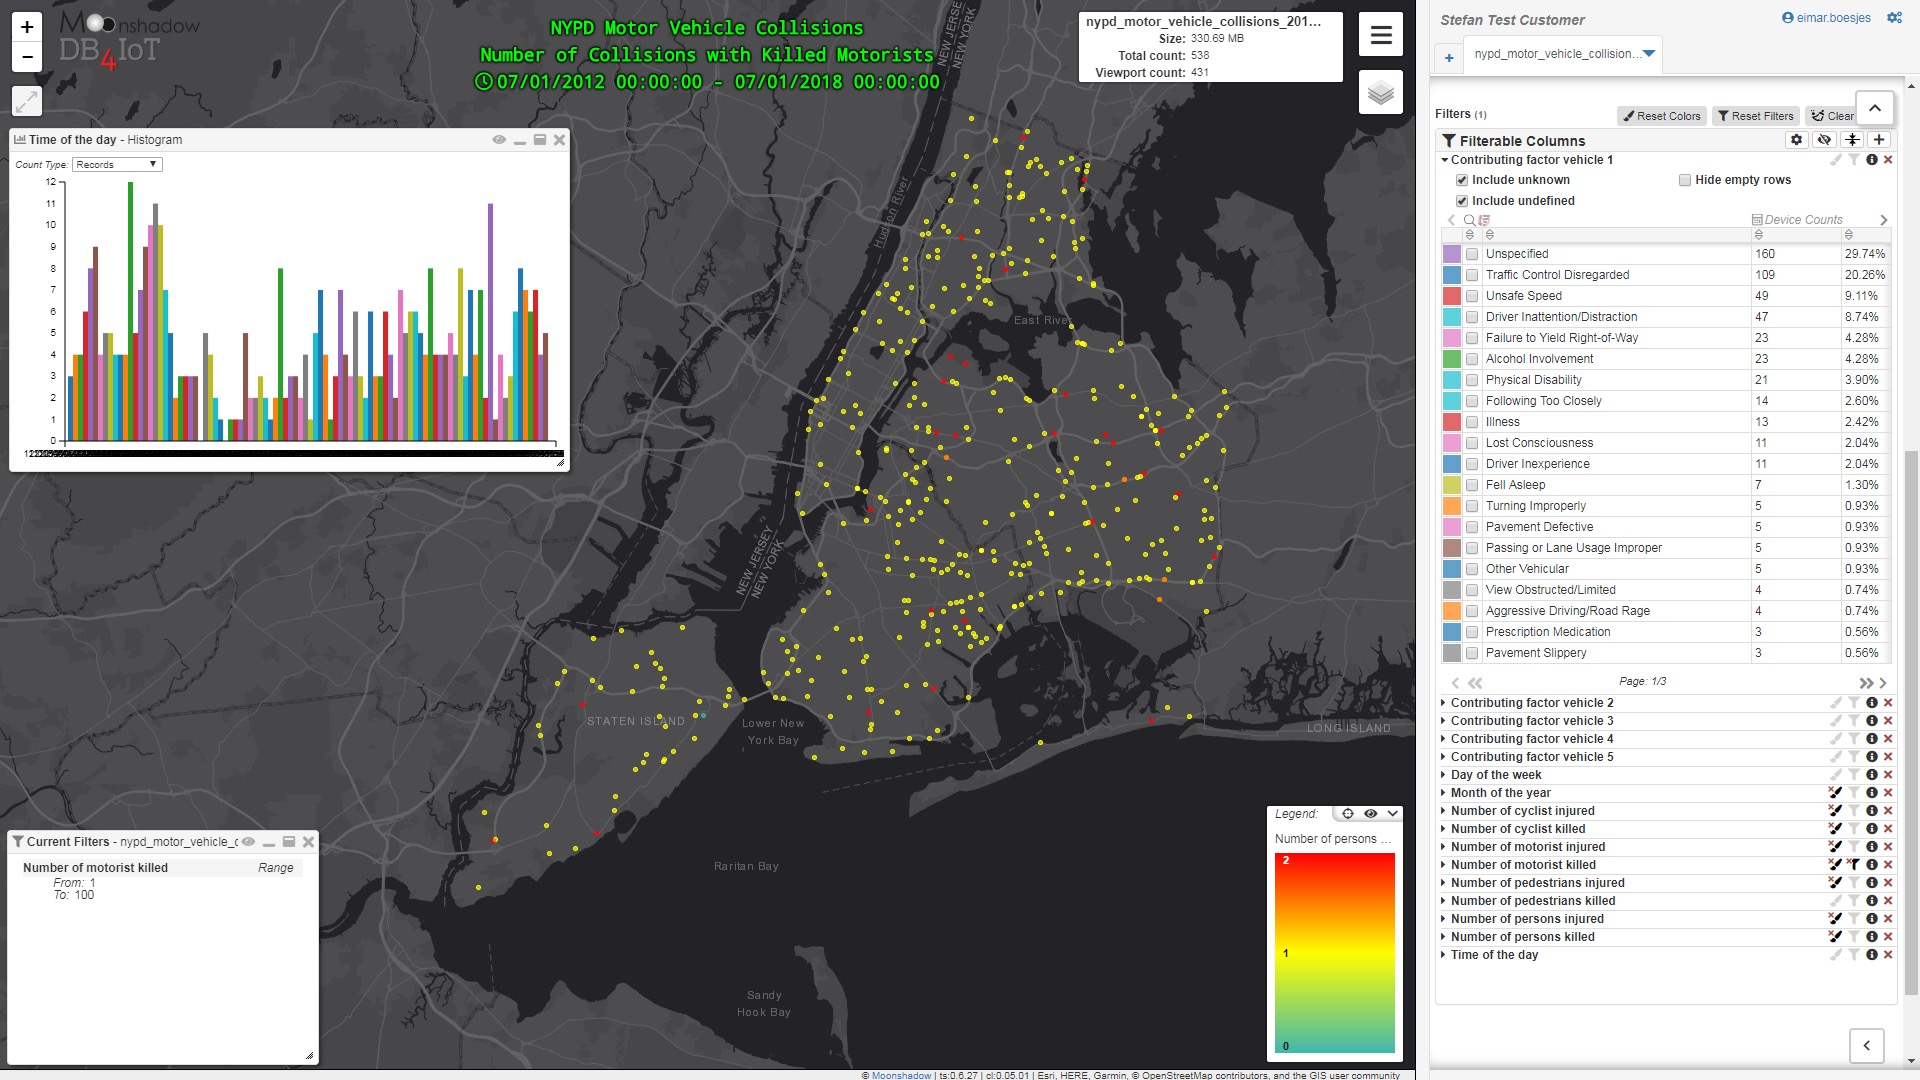
Collisions at night are more often deadly for motorists
106 Collisions with Cyclist Fatalities
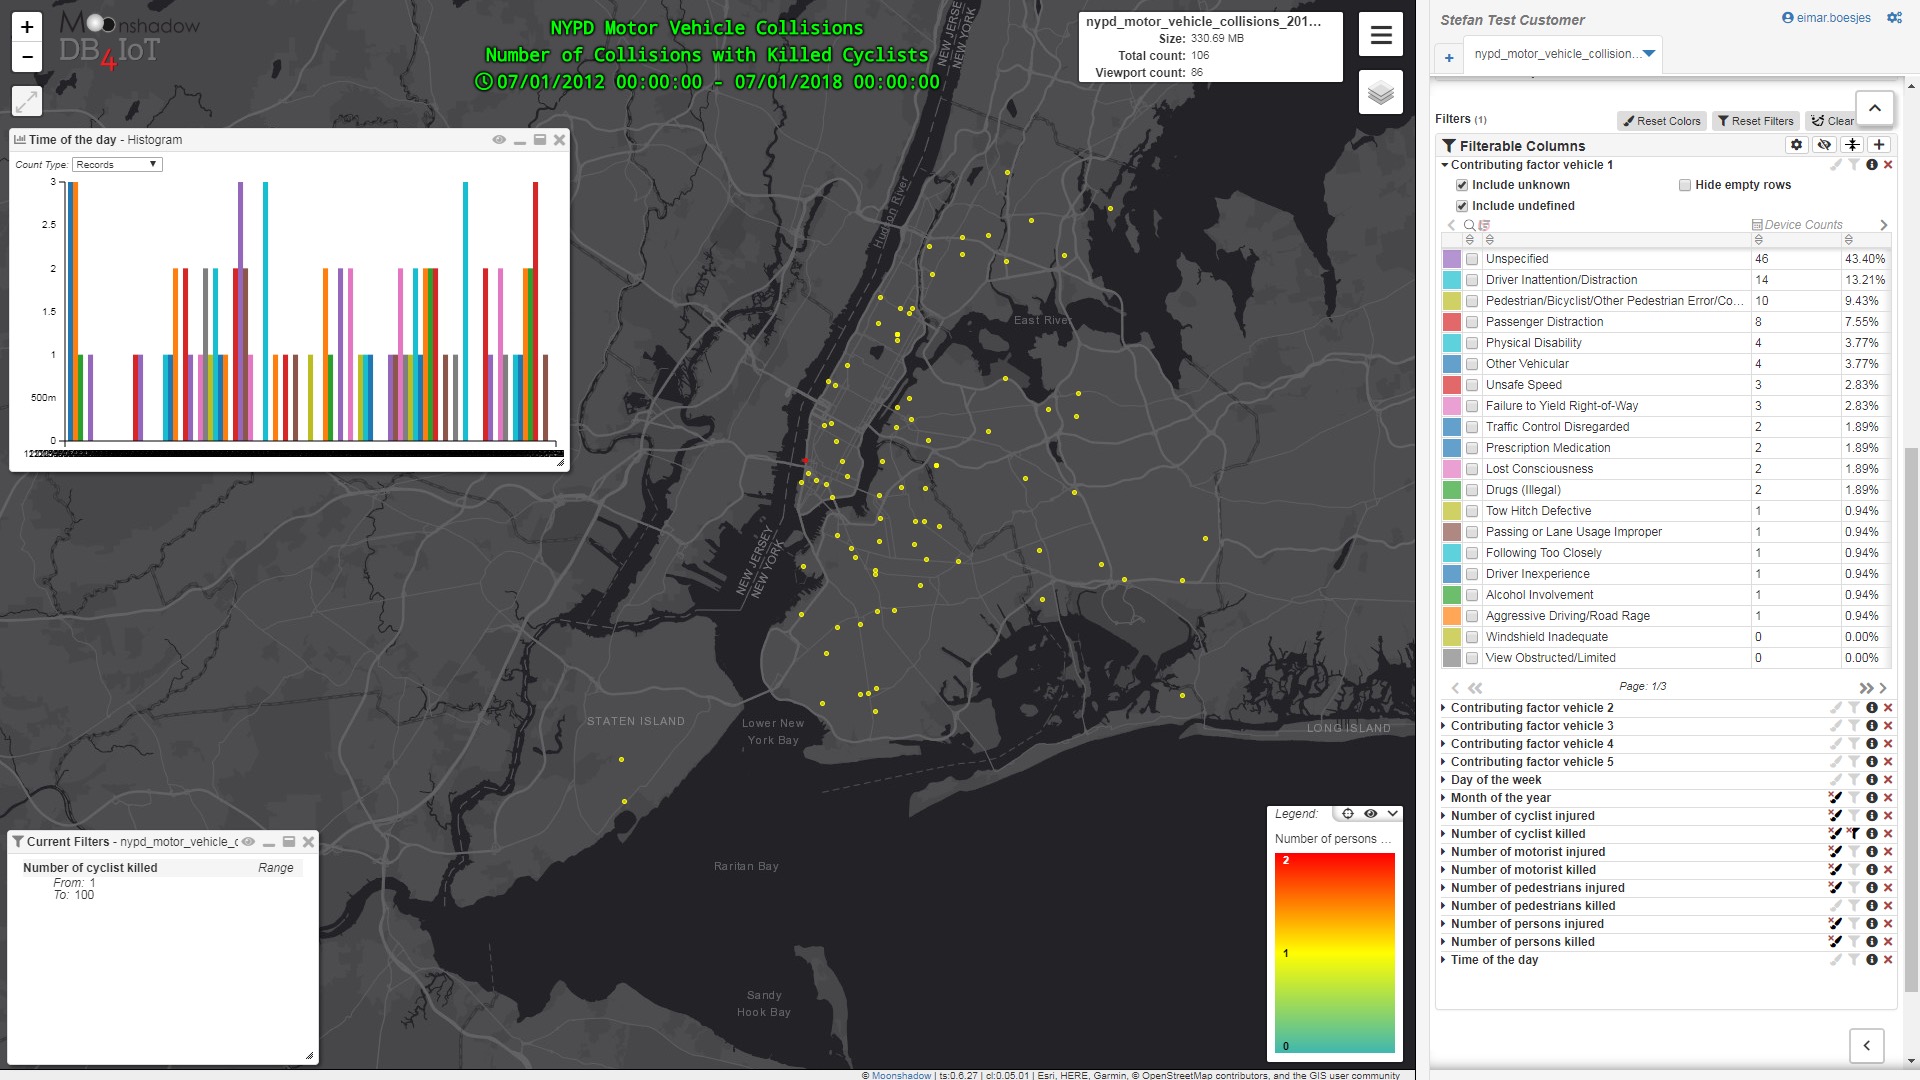
NYPD Motor Vehicle Collisions – Number of Collisions with Cyclist Fatalities
822 Collisions with Pedestrian Fatalities
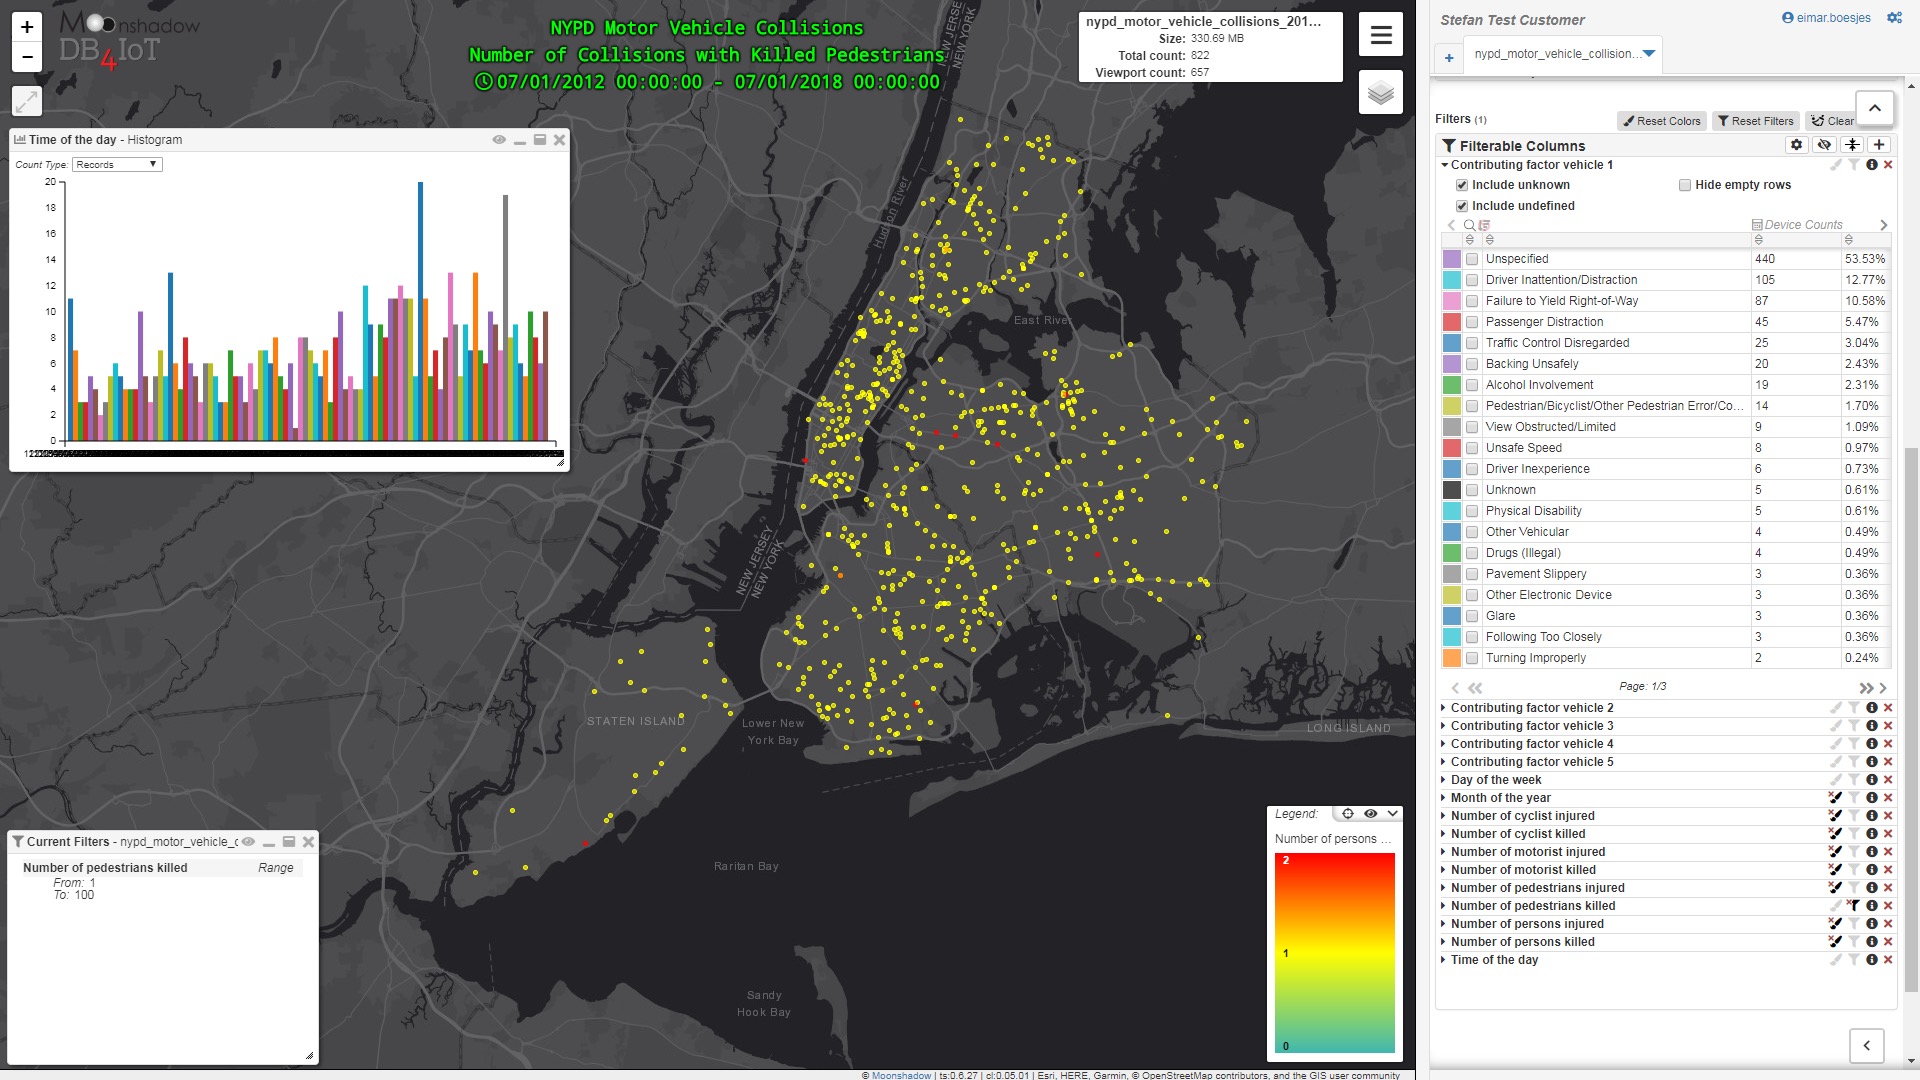
Pedestrians are injured less frequently, but four times more likely to die in collisions with motor vehicles


