Big Data Analytics for Transit
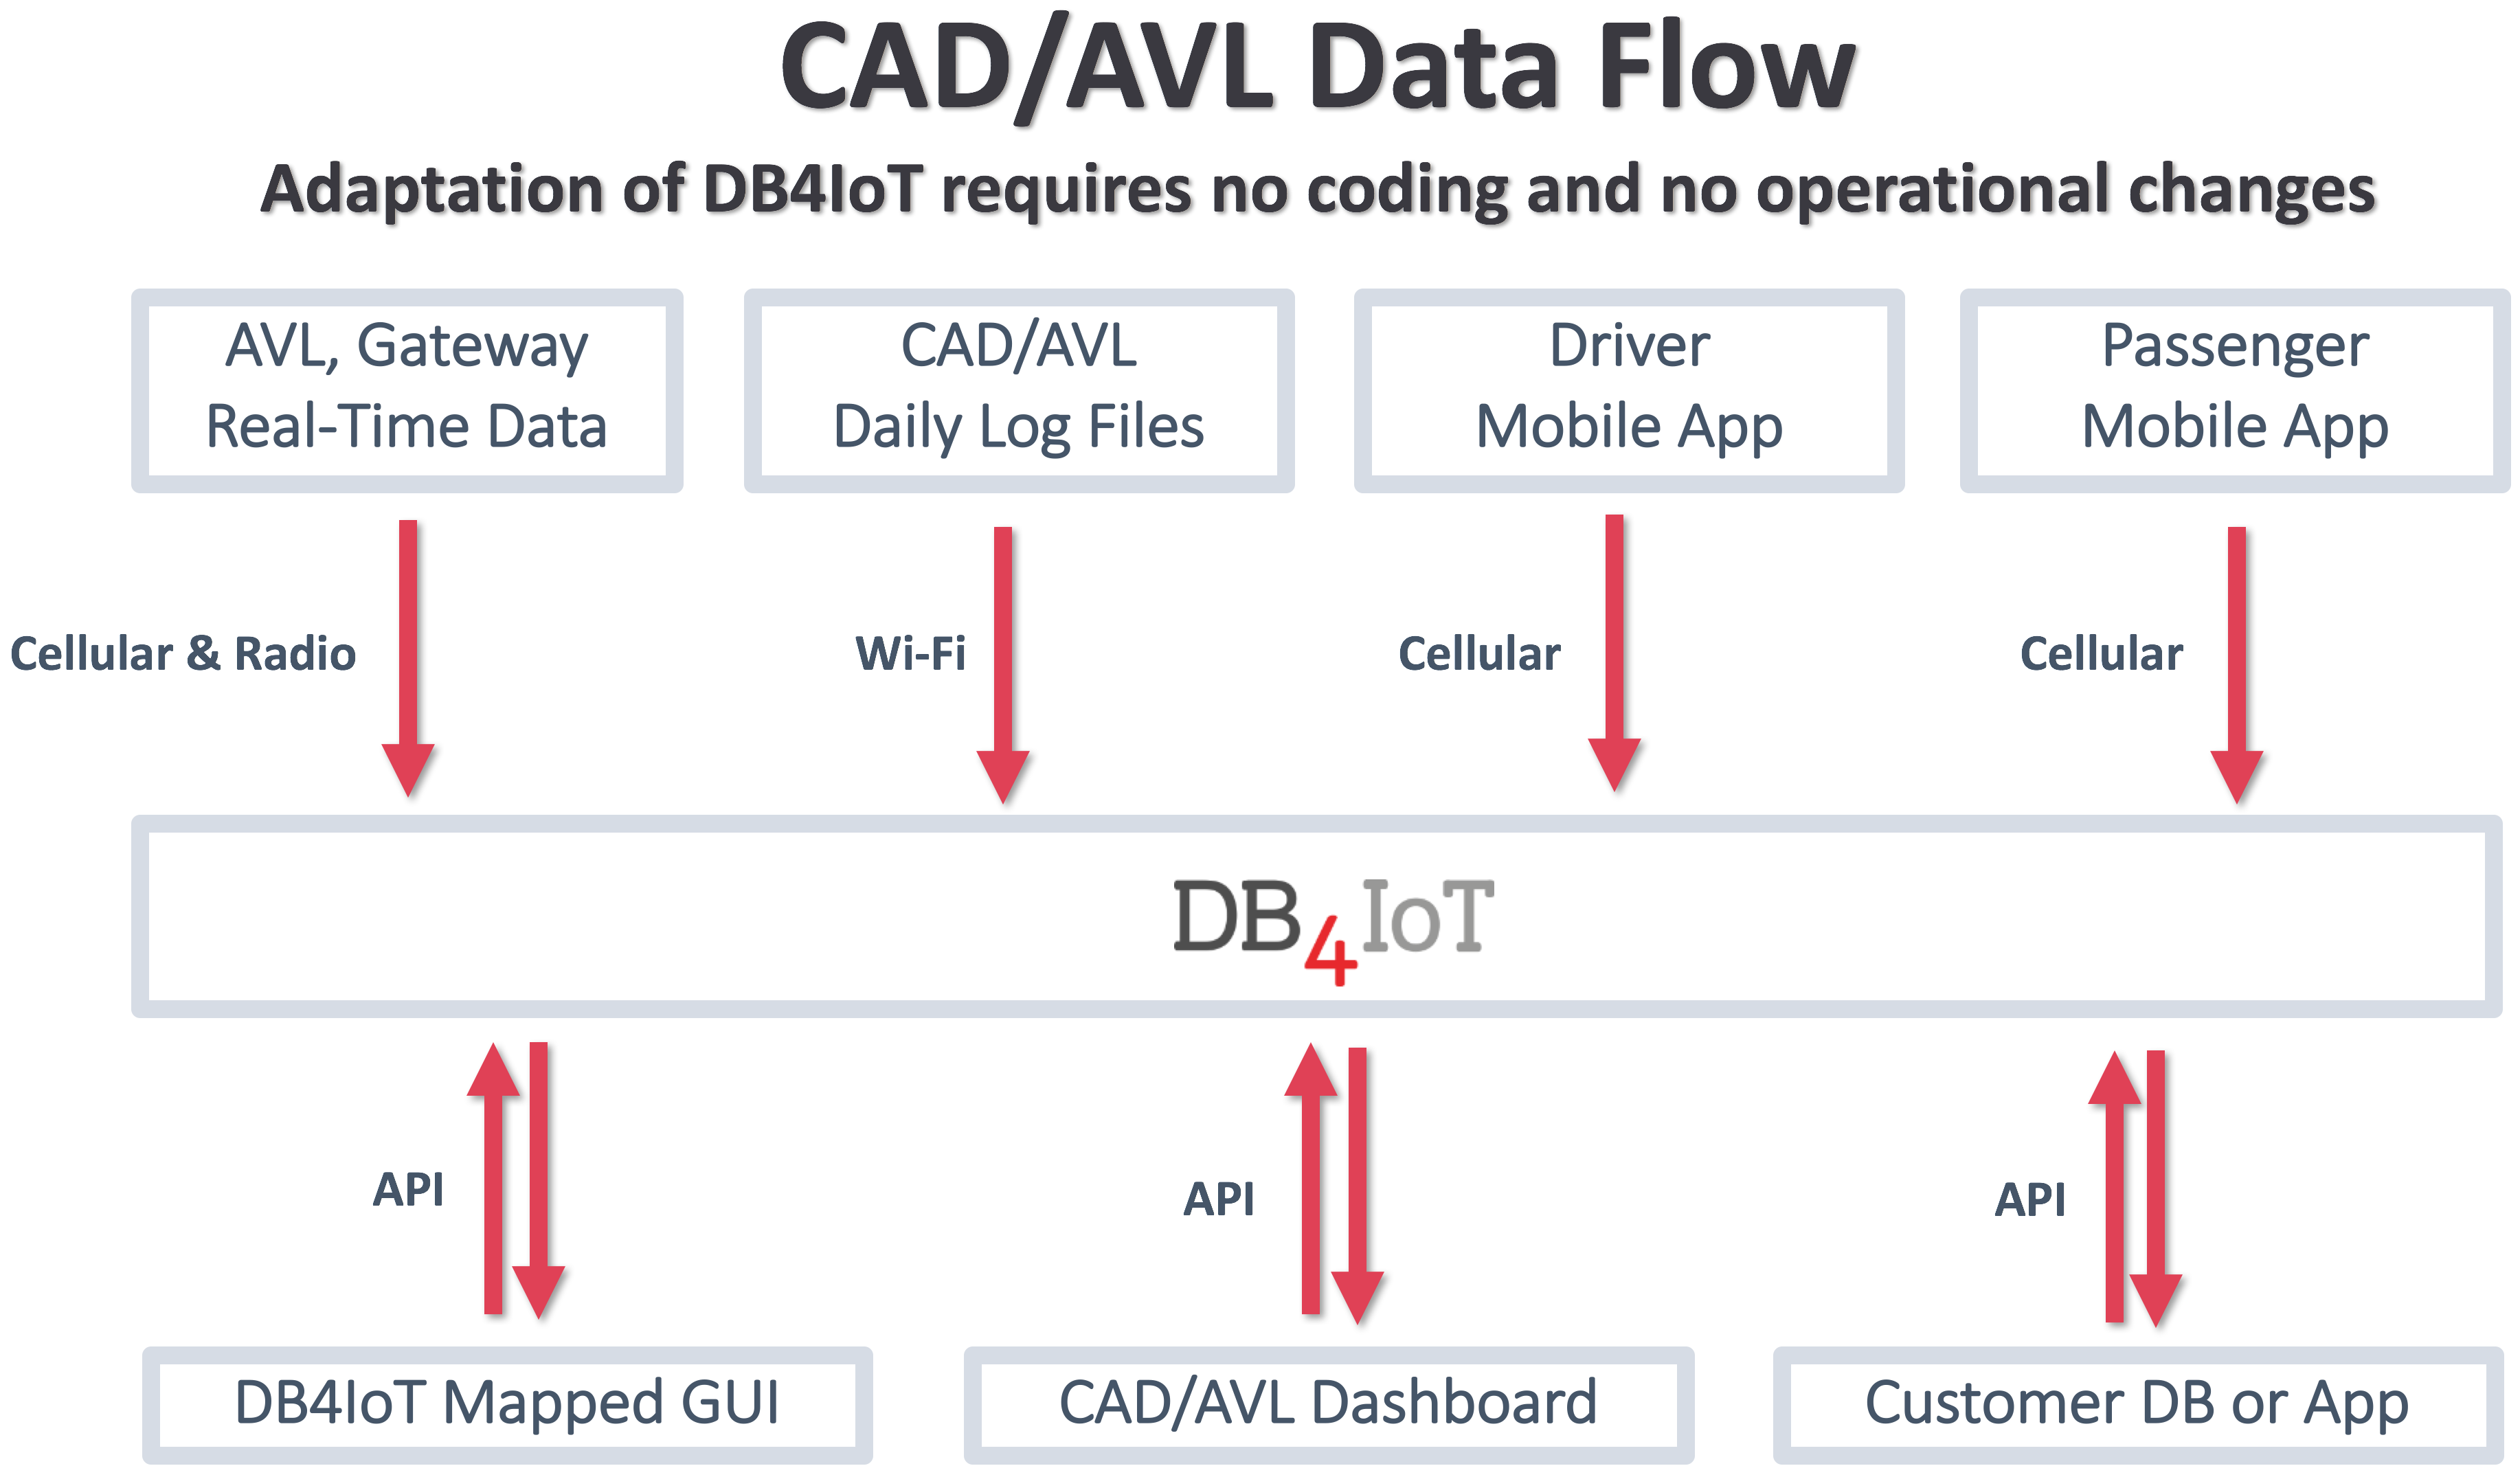
DB4IoT can combine data from many different data sources into a single DB4IoT database
Devices connected to the Internet via cellular or wifi can upload data in real time by sending messages to the DB4IoT servers. Data can also be uploaded through daily log files from CAD/AVL systems or fleet management software. In addition, data can be uploaded from mobile apps used by drivers or even passengers. DB4IoT will automatically combine data from all of these sources as it is coming in.
DB4IoT can turn your “wasted data” into actionable insights that increase efficiency, optimize performance and save time and money.
Public transit agencies have invested millions of dollars and significant IT resources in collecting a wealth of CAD/AVL and ITS data that is often not being used effectively or simply thrown away. As Intelligent Transportation Systems’ (ITS) components generate increasingly large volumes of data, many public transit agencies are struggling with the challenges of storing, managing, visualizing and analyzing all this data.
The challenge is harnessing the collected “Internet of Moving Things” data in the most effective ways to improve operations and drive better decisions rather than letting that data and its potential needlessly go to waste. DB4IoT can turn that “wasted data” into actionable insights that increase efficiency and save time and money.
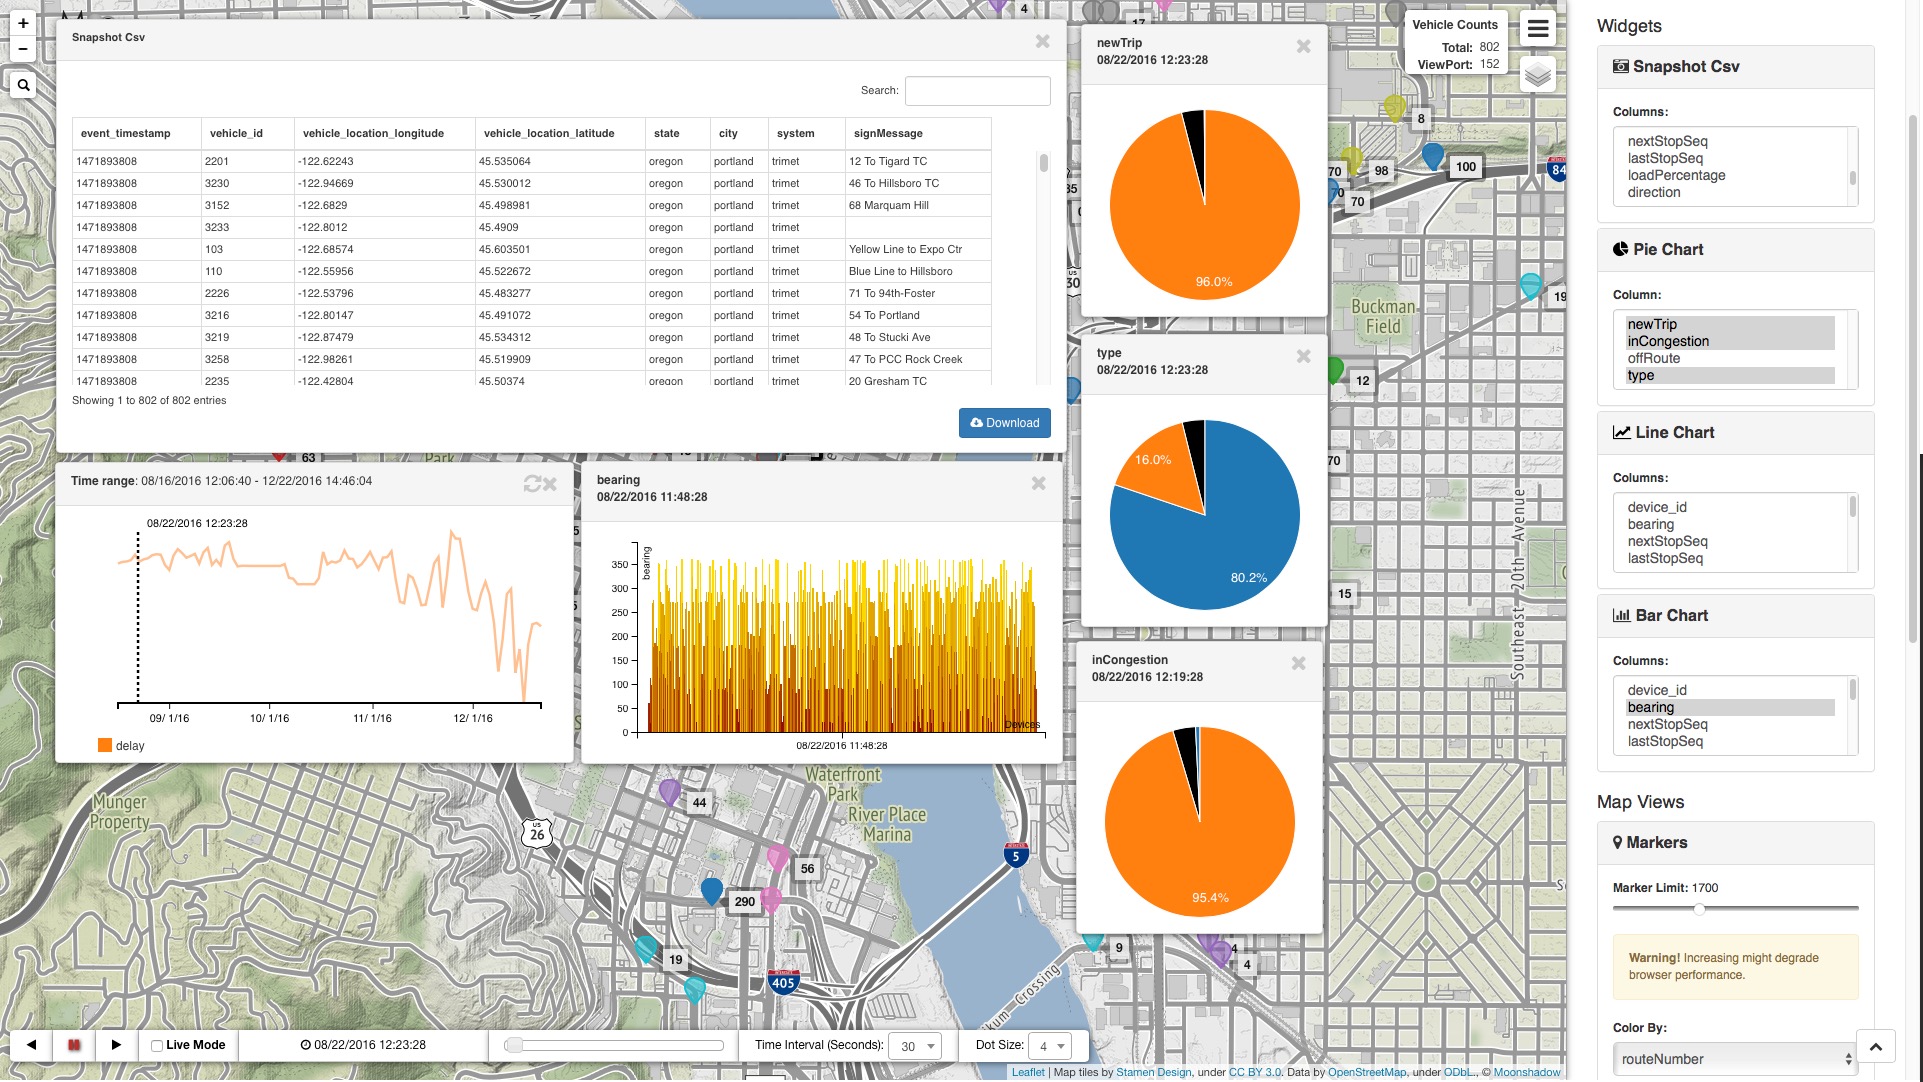
DB4IoT includes an intuitive user interface that allows users to interact with the data from a map interface with familiar navigation controls for zooming in and out and panning. Users can view and play back data animations for any selected sections of time. The DB4IoT user interface communicates with the DB4IoT database through an application programming interface (API). The API is fully documented allowing software developers to write their own user interfaces. Developers can embed maps, graphs, spreadsheets or data directly into their own dashboards that are customized for a specific use case or customer.
Big data is transforming other sectors such as retail and logistics, but it is still in the early days of effective use in the public transit industry. Only now is the transit industry beginning the process of getting a return on the investment in leveraging the wealth of available data it is collecting to enhance service and operations planning, understand driver and passenger behavior, address maintenance issues and state-of-good-repair backlogs, mobile ticketing and fare collection. Agencies now are in various stages of determining when, where and how to use all that “Internet of Moving Things” information.
Maintaining and improving performance and service levels and efficiencies in an era of increasing ridership and often limited budgets and manpower resources for modernization presents a daunting challenge for transit agencies. Big Data and analytics can shed light on everything from vehicle diagnostics, driver performance, fuel efficiency, scheduling and route optimization to asset maintenance, planning, budgeting and more.
With DB4IoT’s state-of-the-art geospatial data visualizations, graphs, charts, web dashboards and analytics, transit analysts, planners and vehicle maintenance managers can glean new conclusions and actionable insights to optimize resource allocation and the efficiency of their transit systems. Db4IoT works with CAD/AVL data generated by leading ITS technology providers such as INIT, Clever Devices and others.